
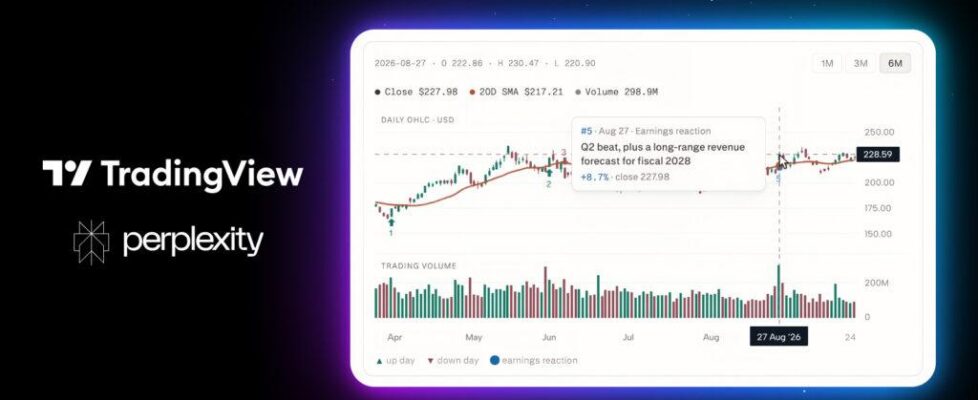
Perplexity Computer integrates TradingView’s Lightweight Charts

Perplexity has integrated TradingView’s Lightweight Charts into Perplexity Computer’s new Inline Visualizations feature.
Perplexity is an AI platform built on the power of accurate AI. Computer is its agent platform, able to handle multi-step tasks for a user — researching a topic, working with data, and producing interactive results instead of just text. In Perplexity Finance, market data now comes in TradingView’s unique, market-leading charts formats, with Computer’s ability to customize to each user’s needs.
Much of the integration’s value is in how users shape the charts by asking. A request like “Show NVIDIA’s price history” can be followed with “Show it as candlesticks, add volume, and focus on the last month.” Each follow-up produces a new view — switching chart types, adjusting the time range, comparing additional stocks, or overlaying a moving average — with Computer custom building the chart that fits each question.
Those charts can draw on dozens of tools and integrations in Perplexity Finance, as well as licensed data users bring themselves, presented in the same recognizable formats. Computer reaches for TradingView’s library when it suits the data and the question, and can fold it into more complex work too — research dashboards, portfolio comparisons, and interactive tools for exploring investment scenarios.