

Exclusive: Retail FX/CFD broker shares down 13% in 1H-2022
FNG Exclusive Analysis… The first half of 2022 was certainly a forgettable one for most equity market (and crypto) investors, with a decidedly risk-off environment leading to a fairly large sell-off of all types of financial assets.
The increasing expectation of runaway inflation and rising interest rates (and energy costs), coupled with major geopolitical issues such as Russia-Ukraine and global supply chain problems, led traders and investors of all types to flee to safety. The sell-off picked up steam into the second quarter of 2022, and has yet to abate.
So it should come as no surprise that following what was a fairly strong 2020 and 2021 for Retail FX and CFD brokers, the first half of 2022 was a bit of a different story – at least if you look at the share price action of the publicly traded brokers.
Actually, the FX and CFD brokers did better than “the market”, with the group showing an average decline of 13% (or a median decline of just 6%), versus a 20% drop in the broader S&P 500 index in 1H-2022. (In Europe equity market declines were more modest, with the FTSE 100 down by just 4.5% in the first six months of this year).
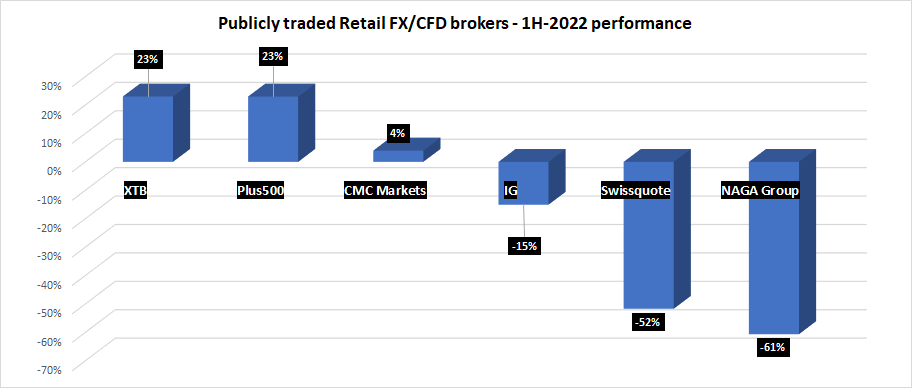
As the graph above shows, hardest hit so far in 2022 were the shares of 2021’s high flyers, Swissquote (SWX:SQN) and NAGA Group (ETR:N4G). Shares of each were down by more than 50%, despite what we believe were continued strong operating and financial results at those brokers. NAGA reported record Revenues for Q1, and we believe that Swissquote, which reports semi-annually, will report a fairly decent 1H-2022, at least in its core eFX business.
But investors and traders seem to be selling last year’s “did well” stocks, without much regard to current performance and outlook. It is just that kind of market right now.
Another interesting public markets story we followed in the first half of the year was eToro. eToro – which was slated to become the largest publicly traded Retail FX broker by virtue of a planned SPAC merger – is probably going to remain a privately-held company, at least for now. As was first reported here at FNG in late May, eToro is likely to cancel its “IPO event” merger with FinTech Acquisition Corp V (NASDAQ:FTCV) amid a drastic fall in the valuation of comp Robinhood and a delay in reporting eToro’s results. The company is now looking to raise money from private equity investors instead.
So what does all this mean for the second half of 2022?
Well as far as share prices go, your guess is as good as ours. But in terms of “real” performance, we believe that 2022 is shaping up as a fairly good year for many (although not all) FX and CFD brokers, and for the industry as a whole. Plus500 (LON:PLUS), which has become something of a CFD industry bellwether, has already stated that it forecasts FY22 revenue and EBITDA ahead of previous market expectations, as the year unfolds.
A fairly basic rule for the online trading business is that results follow trading volumes which follow volatility.
Volatility = trading = profits.
And the first half of 2022 certainly had more than its fair share of volatility, with there being no reason to expect that the second half of the year will be otherwise.
We do think that “the industry” is not seeing nearly the increase in new client signups that it saw in 2020-21 when markets were generally rising, drawing in a whole new generation of app- and social media-focused young traders. But business was probably very good among existing clients, and (we believe) should continue into the second half of the year.
Do you agree? Disagree? Let us know in the comments below.
Some more data on the publicly traded Retail FX brokers in 1H-2022:
| Share Price as of… | Mkt Cap | |||
| 31-Dec-21 | 30-Jun-22 | % change | (USD $M) | |
| XTB | 16.78 | 20.64 | 23% | 544 |
| Plus500 | 1360.5 | 1673 | 23% | 1,900 |
| CMC Markets | 263.5 | 274 | 4% | 947 |
| IG | 813 | 690.5 | -15% | 3,583 |
| Swissquote | 200.5 | 96.85 | -52% | 1,543 |
| NAGA Group | 7.65 | 3.01 | -61% | 129 |
| Average return | -13% | |||
| Median return | -6% | |||
Note that share prices are in the currency listed. Market Cap stats converted to USD.