

TradingView offers faster setup of visibility on intervals
TradingView has made adjusting the visibility of drawings and indicators on intervals a lot easier. Now traders can make changes with just a few clicks.
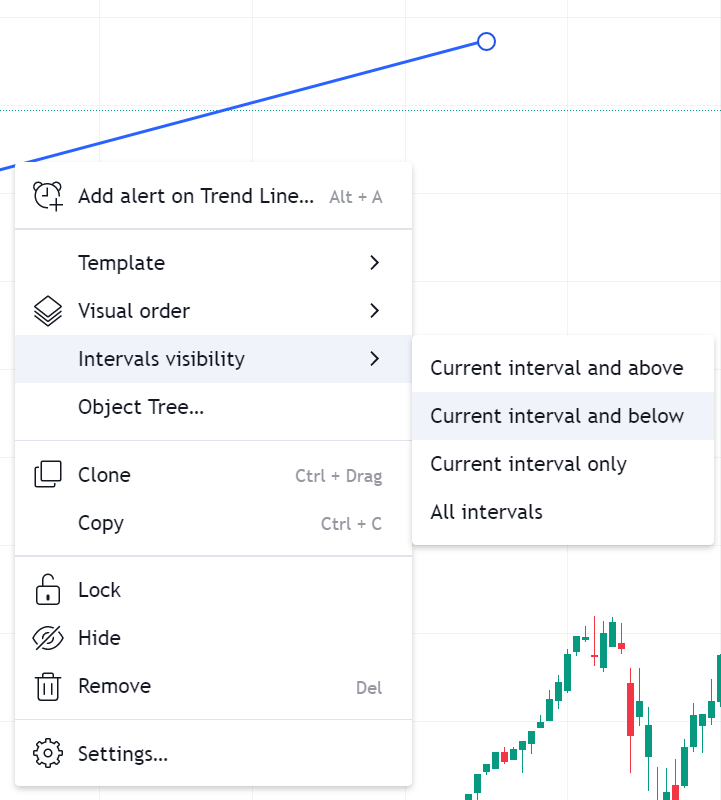
To do this:
- Open the context menu of the drawing or indicator by right-clicking on the selected element.
- Go to the menu item named Intervals visibility.
- Select one of the quick interval visibility options.
- The selected option will set the appropriate settings in the Visibility tab.
- If necessary, you can make additional adjustments through the object’s settings dialog box.
This setting is also available by clicking on the three dots in the floating drawing toolbar and indicator legend.
TradingView regularly enhances its platform functionalities. TradingView has recently added two new indicators to its Crypto Pairs Screener – “Volume 24h in USD” and “Volume 24h Change%”.
Trading volume is a good indicator of the liquidity and popularity of each instrument among investors/traders. The “Volume 24h in USD” indicator shows the total trading volume for this crypto instrument/pair over the last 24 hours in USD.
If you want to know how the dollar volume has changed, just add the “Volume 24h Change%” indicator to your chart. It displays the percentage change in volume over the past 24 hours and may indirectly indicate market moves.
In October, TradingView introduced its new Auto Anchored Volume Profile (AAVP).
It displays only one profile at a time, starting at an automatically-selected point, and extends to the last bar on the chart. When a new period is reached, the previous profile is discarded and a new one begins, allowing you to focus on the most recent market activity.