

TradingView introduces Pine Tables
TradingView has introduced Pine Tables – a new functionality that enables traders to present data in a way that has never been possible before.
Tables are objects that can be used to position information in specific and fixed locations in a script’s visual space. Contrary to all other plots or objects drawn in Pine, tables are not anchored to specific bars: they float in a script’s space, whether in overlay or pane mode, in studies or strategies, independently of the chart bars being viewed or the zoom factor used.
You can create an auto-generated display panel with relevant data for the current symbol and pin it to the side of your screen, or create a dynamic heatmap, or provide quick access to any information available in Pine — the possibilities are endless. The tables can be used in conjunction with all other PineScript features to further improve your existing indicators.
Go to the Pine User Manual’s page on tables to jump right in and start creating tables.
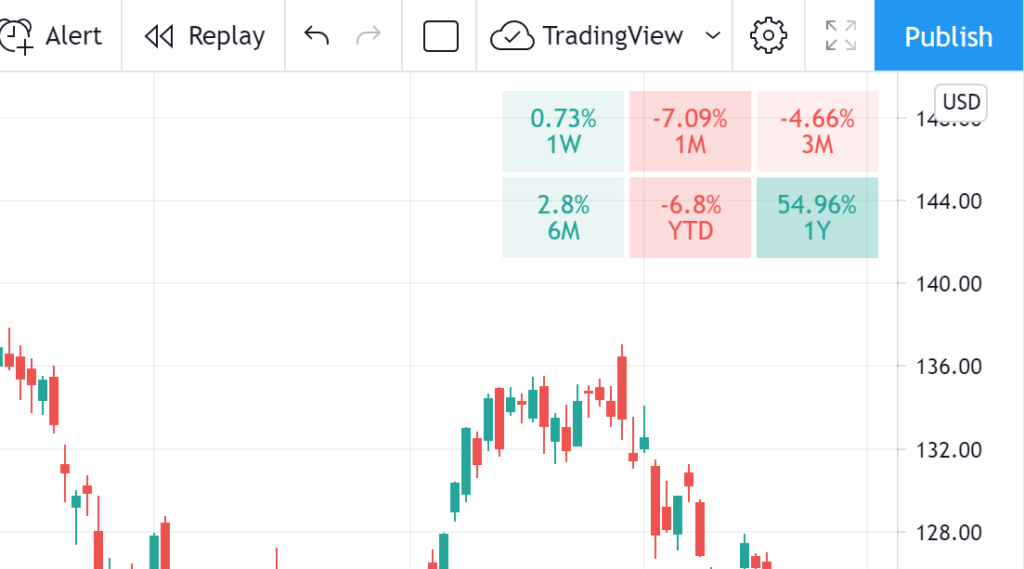
This performance table, inspired by TradingView sidebar’s “Performance” section, helps you track the performance of the chart’s symbol:
Earlier in May, TradingView introduced a new built-in Pine indicator – Technical Ratings. This indicator combines the ratings of multiple different technical indicators to make it easier for traders and investors to find profitable trades.
To use the new indicator, open the Indicators tab and select Technical Ratings.
The recommendations given by the indicator are based on the ratings calculated for the various indicators included in its composition.
The overall rating of the indicator includes two large groups of indicators. The first consists of SMAs and EMAs with different lengths (MA lengths are 10, 20, 30, 50, 100 and 200), the Ichimoku Cloud, VWMA and HullMA. The second is calculated based on oscillators such as RSI, Stochastic, CCI, ADX, AO, Momentum, MACD, Stochastic RSI, Williams %R, Bulls and Bears Strength and UO.