

Spotware releases cTrader Desktop 4.0
Fintech company Spotware Systems today announces the release of cTrader Desktop 4.0.
The new version of the platform introduces Active Charts in conjunction with an increased range of hotkeys, a smart chart search, as well as a functionality to copy/paste chart drawings.
The Chart toolbar provides a single space to manage charts for uttermost convenience. Workspaces, Layout modes, Object manager, Сhart Preferences, as well as favourite timeframes are now available on the top horizontal menu, above charts, for ease of use.
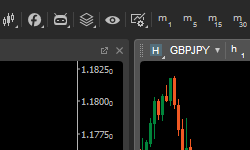 Additionally, the introduction of Active Charts, paired with direct hotkey application delivers a whole new trading experience. A trader can activate the chart by simply clicking on it, and gain the ability to change chart types and settings, zoom in/out, and apply favourite timeframes to the chart in a matter of clicks.
Some of the new hotkeys simplify the most common tasks in cTrader and others bring new useful features. You can find the list of all hotkeys and change default assigned keys in settings.
- Space – Open Smart Chart Search
- Ctrl + C, Ctrl + V, Ctrl + X – Copy, paste and cut chart drawings
- Ctrl + Tab, Ctrl + Shift + Tab – Switch between charts
- Ctrl + Q – Show/hide side menu on the left
- Ctrl + W – Show/hide Tradewatch at the bottom
- Ctrl + E – Show/hide Active Symbol Panel on the right
- Ctrl + N, Ctrl + Shift + N – Open new chart, attached or detached
- Ctrl + D, Ctrl + I – Open Object Manager on Drawings or Indicators tab
- Ctrl + A – Select all drawings
- Ctrl + H – Hide/show all drawings
- F1 – Open Help Center
- Shift + Drawing – Constrained drawing: 45 degrees for lines, rectangle, or circle
- Ctrl + Drawing – Keep drawing instrument selected after finishing with drawing
Smart Chart Search is a new and quick way to alter symbols and periods, add cBots and indicators, or apply chart templates. Press Spacebar to start typing, then use Down and Up keys to select an item and press Enter to apply changes.
Traders also get the ability to copy and paste chart drawings. They can use Ctrl + C and Ctrl + V to copy and paste drawings between charts. Drawings are copied as a JSON formatted text, so traders are free to share them with others.
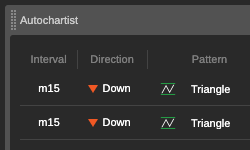 The Autochartist Market Analysis tool can help traders make more informed trading decisions, get acquainted with different technical analysis concepts, and gain extra validation of their own analysis.
Autochartist identifies potential trade opportunities using Chart Patterns, Fibonacci patterns, and Key Levels. The analysis is generated per symbol, for a timeframe as low as 15 minutes, providing you with a graphical illustration and information on the direction of potential price movement along with the forecasted price.
Furthermore, the latest version of the desktop platform adds the ability to deposit and withdraw funds to/from demo accounts allows users to observe the real-life trading picture, as opposed to the usual demo funds option.
In addition, traders can configure to change the symbol in Active Charts from MarketWatch or TradeWatch. They can also sync Active Charts with the Active Symbol Panel for maximum convenience.
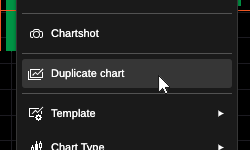 Also, traders can now fully duplicate a chart with the exact symbol, drawings, indicators, and settings by selecting Duplicate in the right-click menu.
In the latest version of the platform, cBots and custom indicators can handle keyboard events and assign custom hotkeys.
There is also an API for handling chart activation/deactivation. Only an active chart will get keyboard and custom hotkey events. The new API allows tracking when a chart is activated or deactivated.
Finally, a new cBot sample was added to demonstrate hotkeys API. With this cBot traders can send market Buy and Sell orders, as well as close positions using configurable hotkeys. It can be used with Visual Backtesting for manual strategy testing.