XTB posts another strong quarter in Q2 2026 although Revenues down 9% to $261M

It is not often we say that a company had a great quarter, when its Revenues and Profits are down nearly 10% from the previous period.
But that is certainly the case with Poland based CFDs broker XTB, which answered many of the questions some detractors had, about whether its monster Q1 was an anomally, or a “new normal” level for the company.
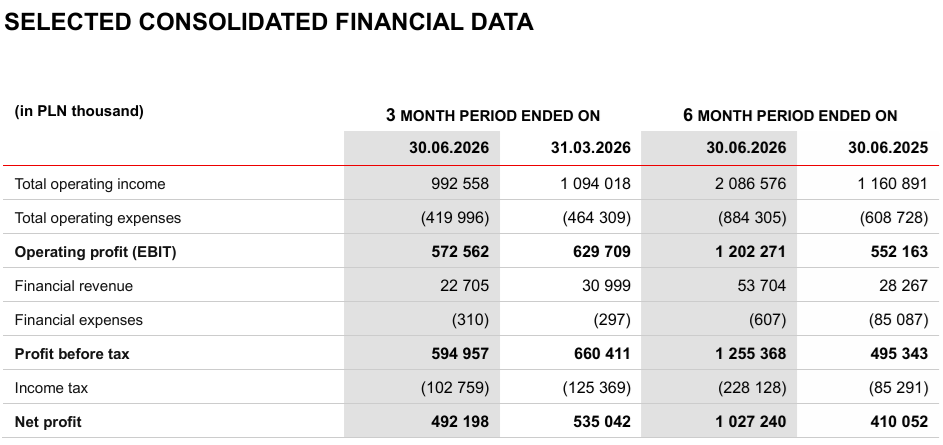
After Q1 2026 saw Revenues soar by 79% at XTB to PLN 1.09 billion (USD $288 million) from what was already a previous company best, XTB reported Revenues of PLN 992.6 million ($261 million) for Q2 2026. That’s 9% below Q1 levels, but still well above any previous high for XTB.
In a similar vein, XTB saw Net Profit of PLN 492 million ($130 million) in Q2, 8% below Q1’s record $141 million. The most XTB had ever earned before 2026 in any quarter was $80 million.
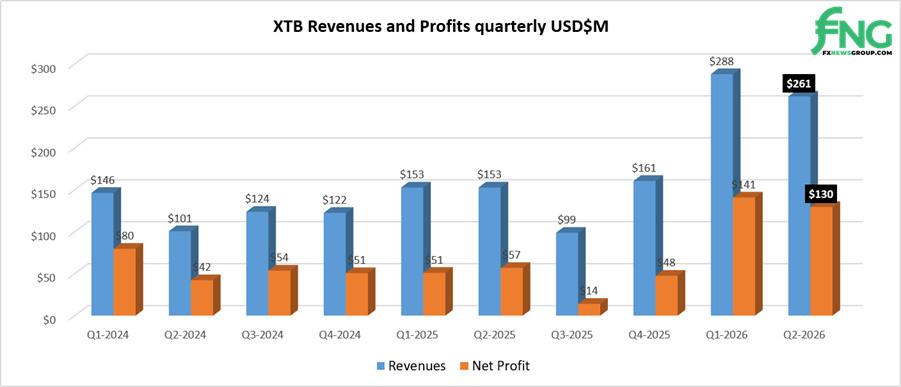
Needless to say, the first half of 2026 overall was an absolute best-ever 6-month period for XTB, as evidenced in the graph above.
What drove growth in H1 2026 at XTB?
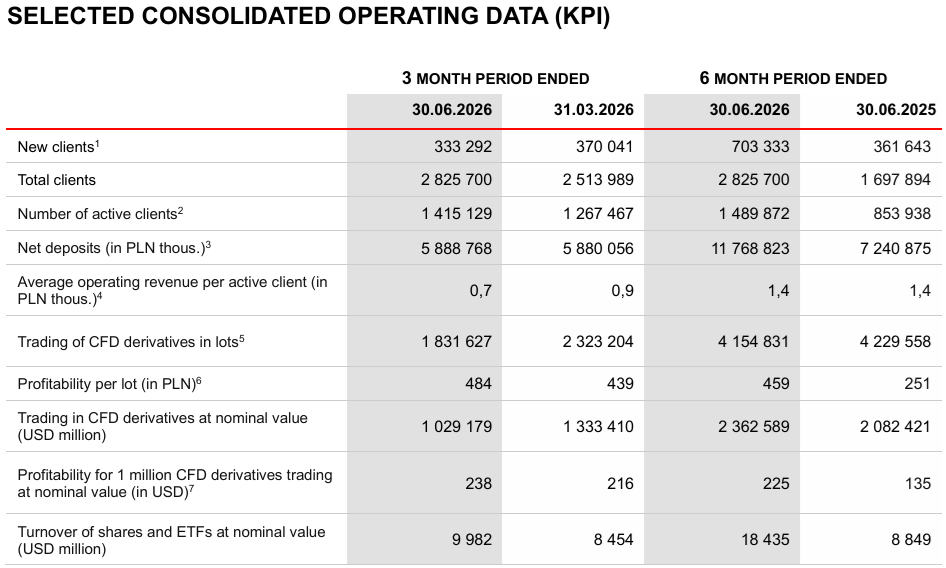
In the first half of 2026, XTB generated a record level of operating revenues amounting to PLN 2,086.6 million (an increase of 79.7% y/y). The significant factors determining their level were the consistently growing number of active clients (an increase of 74.5% y/y), combined with their high trading activity expressed, among other things, in the number of CFD contracts executed in lots (a decrease of 1.8% y/y), and an increase in profitability per lot to PLN 459 (H1 2025: PLN 251).
The first half of 2026 in the financial markets marked an extremely dynamic period full of extremes, with the greatest interest seen in commodity market instruments – particularly gold, silver, and crude oil – as well as key stock indices, led by the US markets and the German DAX. While the first quarter was marked by a clear dominance of precious metals in terms of trading volume and investor attention – driven by above-average volatility and the search for investment opportunities – in the second quarter, capital flowed equally into the equity market, favoring the tech heavy Nasdaq index.
The main source of tension in the energy market during the first months of the year was the outbreak of conflict in the Middle East and the blockade of the Strait of Hormuz. As a result, crude oil prices skyrocketed in Q1, gaining as much as 100% since the beginning of the year. Conversely, high volatility in the gold and silver markets was a continuation of the dynamic gains observed throughout 2025. The massive interest in trading these precious metals was driven by highly dynamic price movements: following a sharp correction at the turn of January and February, the market managed to partially recover its losses before entering a deeper and more sustained downward trend in March, which continuously attracted speculative capital.
The second quarter brought a clear shift toward the equity market. US indices more than recovered their earlier losses and broke through to new highs. Fueled by the unflagging artificial intelligence trend and strong results from tech companies, the Nasdaq index surged by approximately 30% from its correction low. At the same time, the broad-based S&P 500 index gained over 15%, while the German DAX swiftly returned to near its all-time highs following a slump in March.
To summarize the entire first half of 2026, investors demonstrated flexibility in their continuous pursuit of market volatility. They efficiently reallocated capital from volatile commodities in Q1 to the equity market in Q2, adapting agilely to the macroeconomic environment.
XTB Trading Volumes Q2 2026
Trading volumes at XTB came in at $343 billion monthly in Q2 2026, which was down from $444 billion monthly in Q1. However profitability per USD 1 million traded continued to increased, to $238, versus $216 in Q1 – and versus an average of $109 throughout 2025.
Revenue by Instrument Class
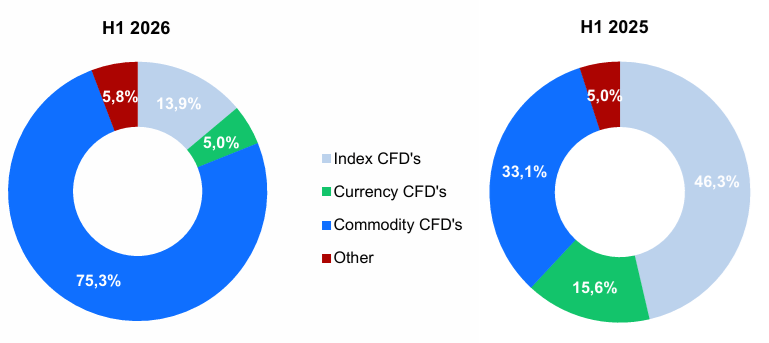
An analysis of the structure of the Group’s gross result from operations on financial instruments (hereinafter: the gross result on instruments) in the first half of 2026 indicates a clear dominance of commodity-based CFDs (contracts for difference). Their share in this result increased to 75.3% (compared to 33.1% in the first half of 2025). This increase was a direct consequence of the high profitability of instruments based on gold, silver, crude oil, and cocoa quotations.
The second most profitable category comprised index-based CFDs, whose share in this result amounted to 13.9% (compared to 46.3% in the first half of 2025). This was a result of the high profitability of transactions on instruments based on the US 100 and US 500 American indices. In turn, currency-based CFDs accounted for 5.0% of the gross result on instruments, which represents a decrease compared to the corresponding period of the previous year (15.6%). The most profitable financial instruments in this category were CFDs based on the Bitcoin and Ethereum cryptocurrencies.
Client acquisition and activity
The foundation of XTB’s sustainable growth remains its steadily expanding client base and the rising number of active clients. In H1 2026, the Group reported record-high results in this area, acquiring 703,333 new clients (compared to 361,643 a year earlier), representing a dynamic increase of 94.5% YoY. Following this record acquisition, the number of active clients also rose, reaching 1,489,872 – a 74.5% increase compared to 853,938 in the corresponding period of the previous year.
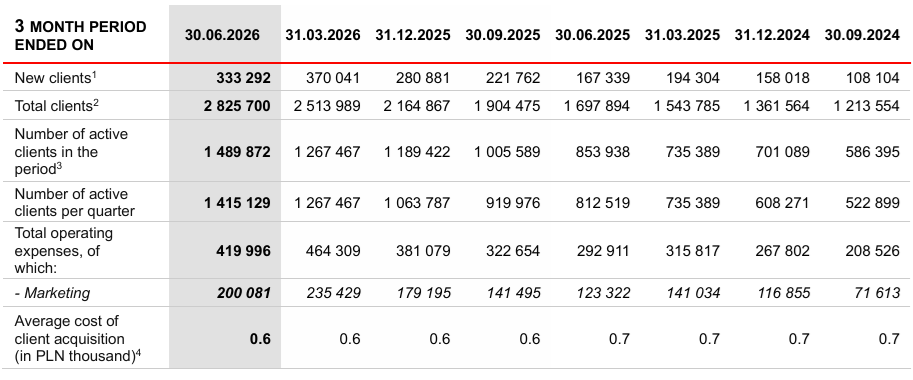
The Management Board’s ambition for 2026 is to acquire an average of at least 250-290 thousand new clients per quarter. As a result of the initiatives undertaken, in the first 28 days of July 2026, the Group acquired a total of 92.8 thousand new clients. Additionally, from a medium-term perspective (defined as a three-year horizon, i.e., 2027-2029), the Management Board’s ambition is to increase the number of new clients by approximately 30% y/y, while assuming that the average cost of acquiring a client will remain at a similar level as in 2023-2026.
Strategic plans
The Board’s ambition is for XTB to be associated with the leading all-in-one investment application in Europe, offering clients easy, smart and efficient ways to trade, invest and save, while providing instant access to their money.
The transformation of XTB from a CFD broker to a modern FinTech entity providing a universal investment application has been progressing in recent years. This process will be consistently continued in 2026 and subsequent years, forming the foundation for the Group’s further growth.
Another strategic move of note in Q2 was the rebranding of XTB’s B2B arm from X Open Hub, to XTB Institutional. Although a relatively small part of the company (less than 5% of overall group Revenues), XTB expects to grow XTB Institutional in the coming months and years.
More highlights from XTB’s Q2 2026 results follow below. XTB’s full Q2 2026 results summary can be seen here (pdf).