
Admirals revenues collapse in H2 to just €4M, 2025 loss €18.5M
Things have gone from bad to worse at Estonia based Retail FX and CFDs broker Admirals Group AS.
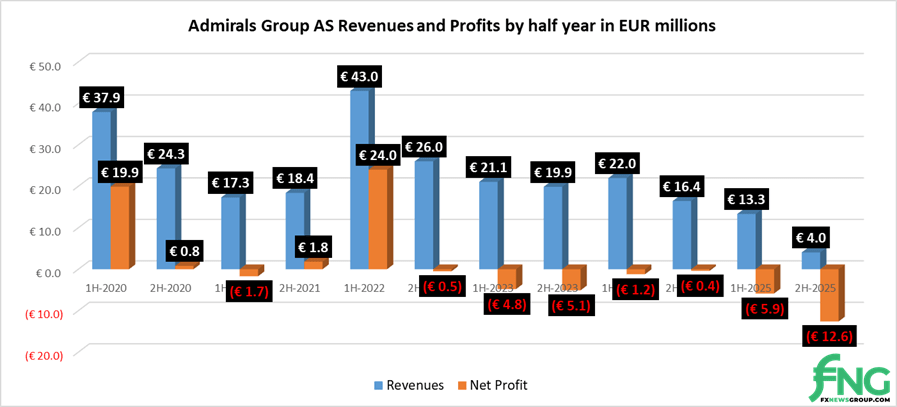
Admirals has released its unaudited financial results for 2025, indicating that the company’s business (and revenue base) collapsed in the second half of 2025 – and that was after a historically bad first half of the year at the company.
After posting a multi-year low for revenues (€13.3 million) in the first half of 2025 alongside a net loss of €5.9 million in H1 2025, Admirals saw second half revenues decline by another whopping 70% (!!), coming in at just €4.0 million in H2 2025 – the first time that semi-annual revenue dipped below the €10 million level (not to mention the €5 million mark) at Admirals since the 2010s decade.
As recently as the first half of 2022, Admirals brought in €43 million in revenue – more than 10x the latest figure.
Admirals’ net loss of €12.6 million in the second half of 2025 brought its net loss for the full year to €18.5 million – more than its entire annual revenue base of €17.4 million.
In explaining the figures, Admirals put out a few brief notes saying that in 2025 lower client trading activity in the Group’s core European markets, together with the ongoing impact of a temporary pause in EU client onboarding, materially reduced net trading income. However we had reported that Admirals restarted EU client onboarding early in 2025 (after halting onboarding for most of 2024), which doesn’t at all account for the drastic decline specifically in the second half of 2025.
If anything, activity should have started ramping up in the second half of 2025, and that clearly didn’t happen.
Admirals also stated that the Group responded by lowering costs and continuing its operational realignment. Total operating expenses decreased by 18% to €34.8 million in 2025 (2024: €42.4 million). The decline in net trading income outpaced the reduction in operating expenses, reflecting lower client activity and the lagged impact of the EU onboarding pause.
The number of active clients stood at 29,455 as at year end 2025. Admirals said that rebuilding and expanding the client base is its key focus.
Looking ahead, Admirals stated that its priorities are to rebuild the active client base, improve client activation and retention, and maintain disciplined cost management and a strong compliance framework. The Group believes these actions support a return to more stable performance and long-term value creation for stakeholders.
Admirals Group AS balance sheet and income statement for 2025 follow below.
| Statement of Financial Position | ||
| (in thousands of euros) | 31.12.2025 | 31.12.2024 |
| Assets | ||
| Cash and cash equivalents | 34,065 | 41,607 |
| Due from investment companies | 13,246 | 18,736 |
| Financial assets at fair value through profit or loss | 809 | 1,228 |
| Loans and receivables | 3,536 | 8,315 |
| Inventories | 235 | 665 |
| Other assets | 1,588 | 2,092 |
| Tangible fixed assets | 1,159 | 1,359 |
| Right-of-use assets | 1,762 | 2,541 |
| Intangible assets | 1,904 | 3,304 |
| Total assets | 58,304 | 79,847 |
| Liabilities | ||
| Financial liabilities at fair value through profit or loss | 596 | 334 |
| Liabilities and accruals | 1,860 | 3,326 |
| Deferred tax liability | 0 | 0 |
| Subordinated debt securities | 4,108 | 4,103 |
| Lease liabilities | 2,030 | 2,818 |
| Total liabilities | 8,594 | 10,581 |
| Equity | ||
| Share capital | 250 | 250 |
| Own shares | -1,218 | -456 |
| Statutory reserve capital | 25 | 25 |
| Currency translation reserve | -1,058 | 30 |
| Retained earnings | 51,711 | 69,417 |
| Total equity attributable to owners of the parent | 49,710 | 69,266 |
| Non-controlling interest | 0 | 0 |
| Total equity | 49,710 | 69,266 |
| Total liabilities and equity | 58,304 | 79,847 |
| Statement of Comprehensive Income | ||
| (in thousands of euros) | 31.12.2025 | 31.12.2024 |
| Net gains from trading of financial assets at fair value through profit or loss with clients and liquidity providers | 18,664 | 40,653 |
| Brokerage and commission fee revenue | 1,114 | 1,408 |
| Brokerage and commission fee expense | -2,538 | -3,558 |
| Other trading activity related income | 310 | 489 |
| Other trading activity related expense | -185 | -583 |
| Net income from trading | 17,365 | 38,409 |
| Other income similar to interest | 0 | 947 |
| Interest income calculated using the effective interest method | 1,428 | 424 |
| Interest expense | -491 | -472 |
| Other income | 369 | 3,004 |
| Other expenses | -892 | -233 |
| Net losses on exchange rate changes | -1,361 | -1,016 |
| Profit / (loss) from financial assets at fair value through profit or loss | 0 | -444 |
| Personnel expenses | -11,746 | -13,394 |
| Operating expenses | -20,232 | -25,412 |
| Depreciation of tangible and intangible assets | -2,100 | -2,594 |
| Depreciation of right-of-use assets | -747 | -787 |
| (Loss) before income tax | -18,407 | -1,568 |
| Income tax | -63 | -24 |
| (Loss) for the reporting period | -18,470 | -1,592 |
| Other comprehensive income / (loss): | ||
| Items that subsequently may be reclassified to profit or loss: | ||
| Currency translation adjustment | -1,088 | 864 |
| Total other comprehensive income / (loss) for the reporting period | -1,088 | 864 |
| Total comprehensive (loss) / income for the reporting period | -19,558 | -728 |
| Net (loss) attributable to the owners of the parent | -18,468 | -1,592 |
| Net profit attributable to non-controlling interest | 0 | 0 |
| (Loss) for the reporting period | -18,468 | -1,592 |
| Total comprehensive (loss) attributable to the owners of the parent | -18,468 | -728 |
| Total comprehensive income attributable non- controlling interest | 0 | 0 |
| Total comprehensive (loss) for the reporting period | -18,468 | -728 |
| Basic and diluted earnings per share | -7.59 | -0.65 |