
TradingView updates financials tab
TradingView has released several updates to the financials tab located on the symbol page. If you’re an investor interested in Tesla, Apple or any other company, you can perform deep research by using TradingView’s company financial pages.
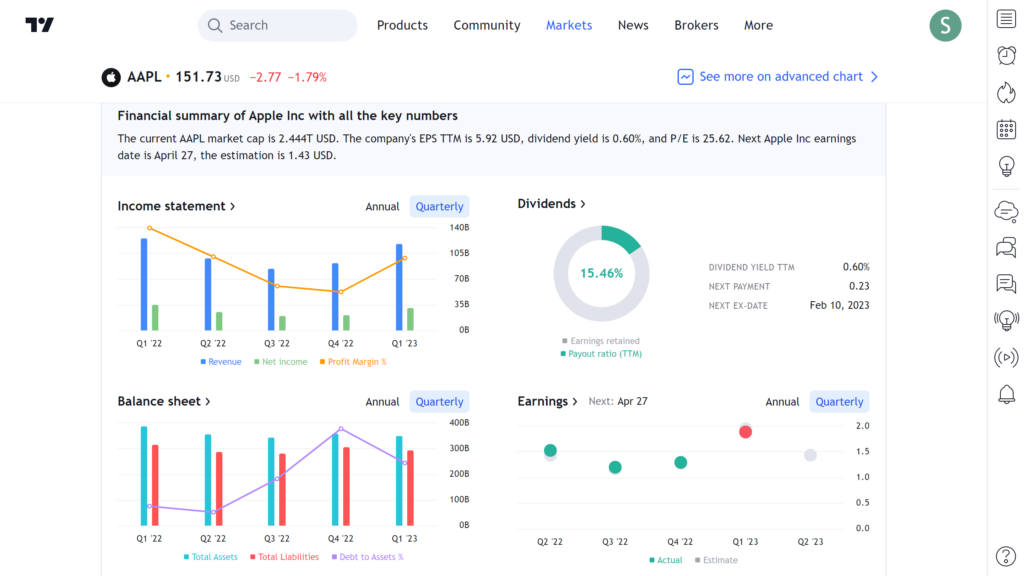
TradingView has updated the Overview page to include more data and visuals. Investors can study important trends in earnings, cash flow, profit margin, and more.
The Statements, Statistics, Dividends, and Earnings sections have also been updated with helpful features.
- Each financial line item is now more neatly positioned in columns and rows, with drop-down arrows to go deeper into a subsection, and it can be seen by quarterly or annual data.
- The tab now shows year-over-year (YoY) growth.
- Investors can create their own custom bar charts at the top of the page as well by selecting the financial metrics they want to include – just click metric you want to include and the bar chart at the top will do the rest.
Investors will also find a search box in the Statements tab. This search feature can be used to find any fundamental metric in the tab. Type in revenue or something more complex like intangibles or amortization to quickly see specific financial data.
Track the payout history for a company including its quarterly dividends paid, rate of change, history of payouts, and the ex-dividend date. For dividend investors, this page will make a game-changing difference by giving more historical perspective on payouts.
For companies based in Australia or New Zealand, and even some small caps across Europe, investors can now access semi-annual financial data. Certain parts of the business world do things differently, and they prefer to deal in semi-annual data. TradingView has made that possible for companies located in these regions of the world.