

TradingView adds professional analytical forecast to symbol page
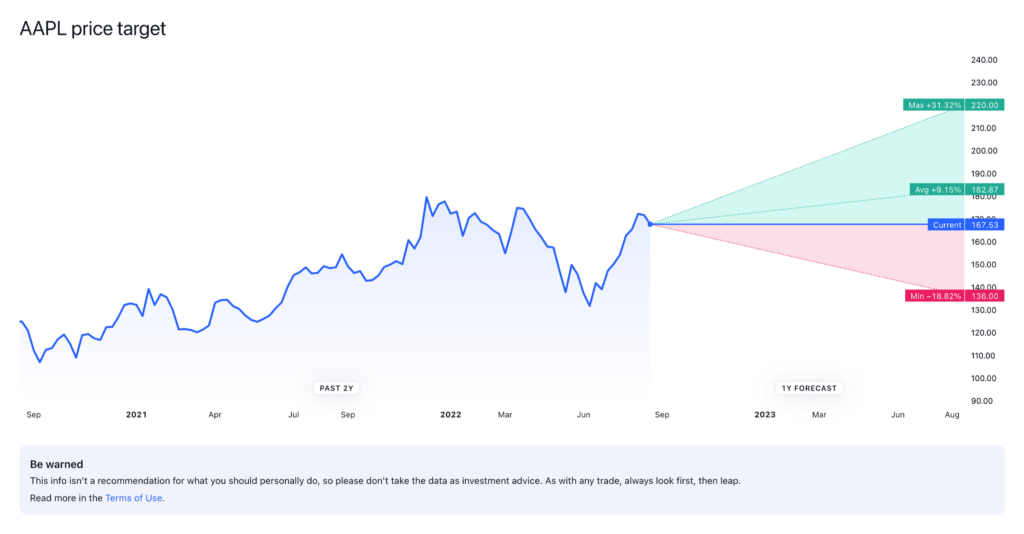
TradingView has added professional analytical forecasts to the symbol page. If you head on over to the page you’ll now find a Forecast tab containing a chart with the annually-projected price levels from FactSet specialists.
For over 40 years FactSet provides access to financial data and analytics for investors around the world. The price prediction levels on the chart reflect the dynamics of price changes over the past two years and forecast possible price behavior by the end of the next year by showing predicted price levels: minimum, maximum, and average.
The forecast is based on the data received from FactSet. It contains an up-to-date analysis of research and analysts’ individual assessments on the prospects of the selected symbol, given the changes in the market and indeed the world.
TradingView has been regularly enhancing its solutions. Earlier in August, TradingView announced a new version of TradingView Desktop adding Screener, Heatmap, Breaking News and Snaps.
You can link a chart and a screener opened in different tabs and/or windows (right-click tab headers and set the same color tag for them). Now selecting an asset on the screener will show its chart in another window. Heavy users of Screener are going to find this very helpful and time-saving, especially those having a multi-monitor setup on their desk.