
TradingView adds “Options expected move” indicator to Supercharts

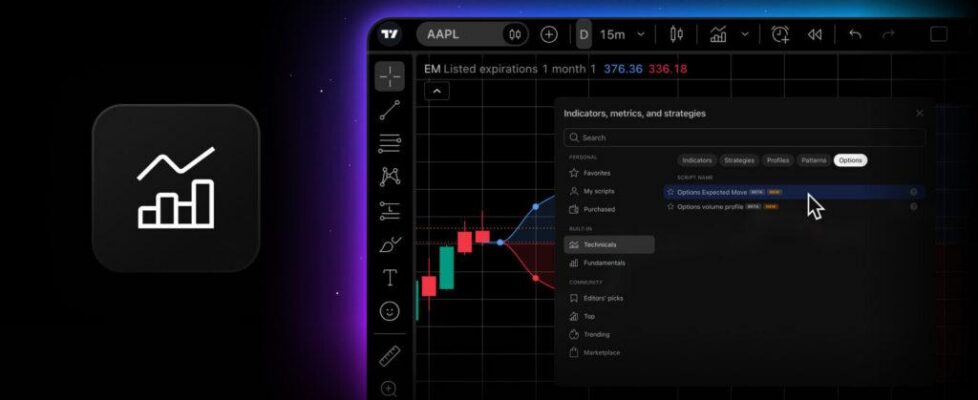
TradingView has added Options expected move, a new indicator on Supercharts.
It takes the at-the-money implied volatility of each expiration and turns it into upper and lower price bounds drawn on the chart of the underlying asset. You see the range the options market expects the price to stay within by each expiration, next to the candles you already analyze.
To add the indicator:
- Open the chart of any underlying asset with listed options, click Indicators, go to the Options tab, and select Options expected move.
- By default, the indicator shows every listed expiration within the next month at one standard deviation. You can change horizon and range width at any time in the settings.
The Mode setting defines which points the cone is built from:
- Listed expirations: Uses the actual expiration dates from the options chain, each with its own at-the-money (ATM) implied volatility and no interpolation
- Fixed terms: Uses synthetic expirations at fixed distances from today (7, 14, 30, 60, 90, 180, 270, and 365 days), with implied volatility interpolated from the listed expirations. This is handy for comparing the expected move across symbols with different expiration calendars
Horizon controls how far into the future the cone extends, from Nearest to 1 year or All. Each horizon includes all the points before it, so 1 month in Fixed terms mode shows the 7-, 14-, and 30-day points. Your choice is kept when you switch between modes.
Std Dev sets the width of the range:
- About 68% probability that the price stays within the range
- About 95% probability
- About 99.7% probability
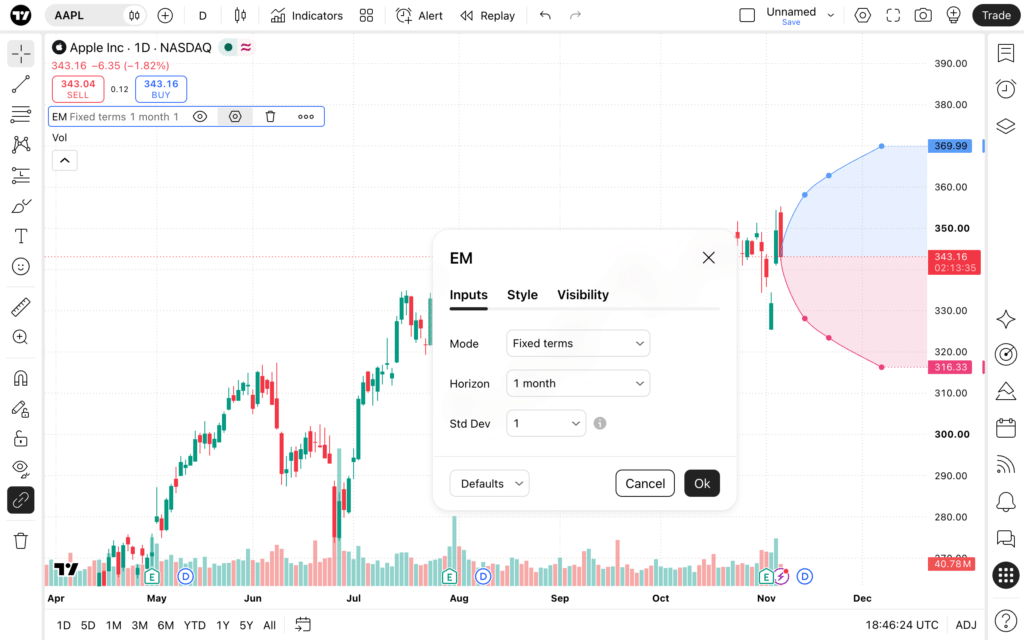
A short horizon at one standard deviation gives a close look at the near term. A longer horizon at two or three standard deviations shows the outer bounds the market prices in for the months ahead.
On weekly and monthly charts, a single bar can cover several expirations, so only the latest expiration within each bar is shown. Points are tied to bar times, so the date on the time scale may differ slightly from the expiration date in the tooltip.
So open the chart, go to Indicators → Options → Options expected move, and see the range the options market is pricing in, right on the candles.