Interactive Brokers integrates 3D Volatility Viewer into TWS platform
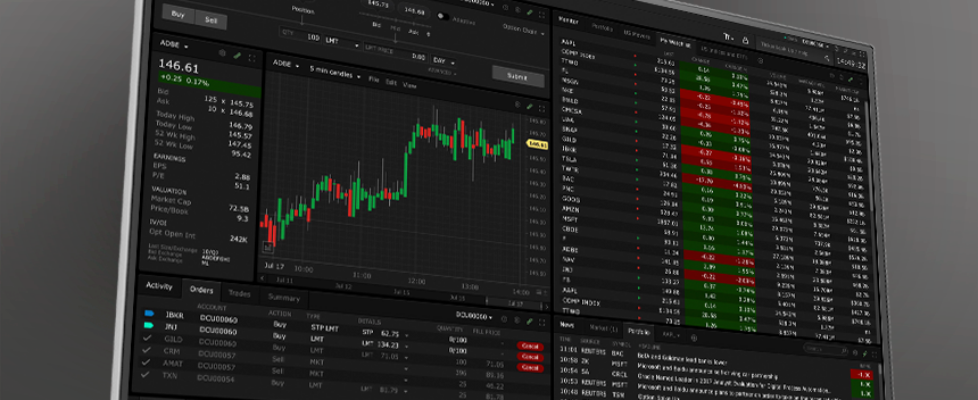
Electronic trading major Interactive Brokers continues to expand the capabilities of its TWS platform.
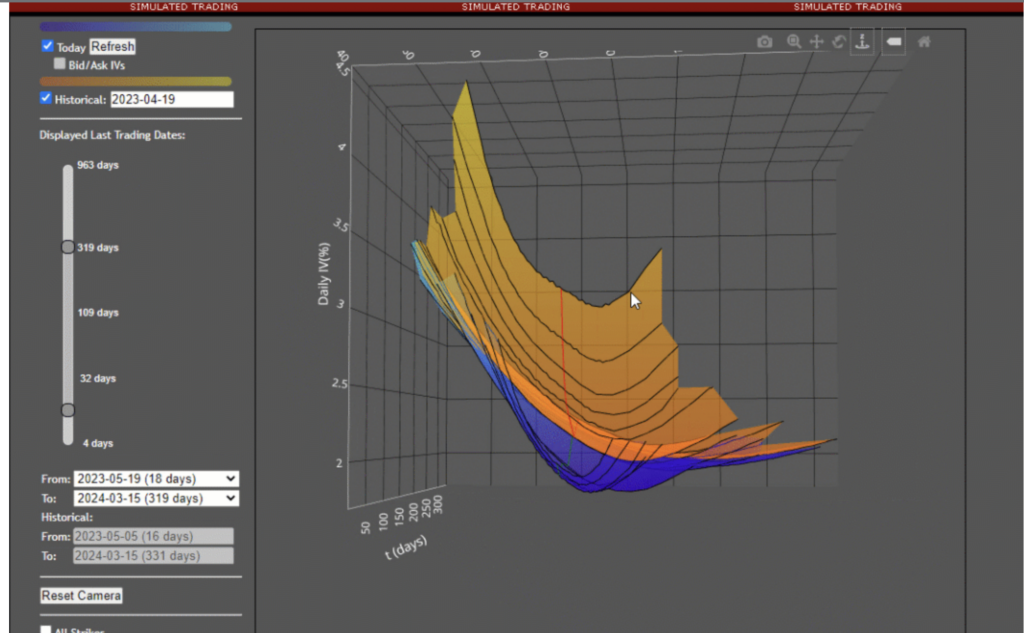
The 3D Volatility Viewer, which allows you to view implied volatility for an instrument, has been integrated into TWS so you can view 3D implied volatility directly within TWS, rather than within a separate tab of your browser.
The integrated 3D Volatility Viewer is available from Mosaic by selecting New Window>Option Analysis>Interactive Analytics>3D Volatility Surface. You can also access from within the Implied Volatility Viewer by clicking “3D” in the top right corner of the Implied Volatility tool.
- Display the model surface together with individual option IV points or compare the current surface with any historical value by plotting them together.
- Click and drag the plot to rotate the view and scroll within the plot to zoom.
- Check “Historical” and choose a date to plot historical data. To see ONLY historical data once it’s loaded uncheck “Today.”
- Change the range of displayed trading dates using the “Displayed Last Trading Dates” slider or using the calendar entry fields.
- Expand the “Extra plot controls” to show contour and value lines and manipulate scaling using sliders.
- See specific data by holding your mouse over a point in the plot.

The latest beta build of the TWS platform also comes equipped with Trading Central updates.
The Trading Central “Value” and “Value Analyzer” tabs have been replaced with a new tab called Fundamental Insight in both Fundamentals Explorer and the Discover tool, respectively.
Fundamental Insight analyzes the vast volume of complex financial data and converts it to actionable insights conveyed to traders through colorful, easy to interpret graphics. Fundamental Insight makes it easier for traders to apply fundamentals principles to their investing decisions.
Both Fundamentals Explorer and the Discover tool are available in IBKR Mobile, Trader Workstation, and Client Portal.


