

US Strong Earnings, Fragile Leadership: The Q1 Reality Check
The following is a guest editorial courtesy of Carolane de Palmas, Markets Analyst at Retail FX and CFDs broker ActivTrades.
One quarter into the earnings season, the message from corporate America rings out with unmistakable clarity: growth is accelerating, beats are widespread, and analysts are still scrambling to catch up. Companies seem to be outperforming expectations by historic margins, revenue seems to be growing robustly, and the engine of the economy appears to be firing on all cylinders.
Yet the reality is more nuanced.
The S&P 500 is not just strong; it is imbalanced. Leadership is increasingly concentrated in a shrinking circle of names, expectations are rising faster than many underlying fundamentals can support, and the market’s structural foundation—while appearing diverse on the surface—is becoming increasingly fragile. The result is a market where the upside case remains intact but has become far less forgiving of disappointment.
When Beats Become the New Normal: Understanding the Scale of Q1’s Outperformance (So Far)
The first striking feature of this earnings season is not simply that companies are beating expectations. Rather, it is the magnitude and persistence of those beats, and what that magnitude tells us about the gap between analyst forecasts and corporate reality.
With approximately 28% of the S&P 500 having reported their quarterly results as of April 24th, the data paints a picture of widespread outperformance. Eighty-four percent of companies have beaten earnings-per-share estimates, a figure that sits well above historical norms and signals that analyst expectations were materially off-target across the market.
But the real story lies not in the percentage of beats, but in their depth.
Companies are delivering earnings that exceed expectations by an average of 12.3%, a figure nearly double what we typically observe over longer historical periods. This is not a case of companies clearing a modestly-set bar or benefiting from depressed forecasts set during uncertain times. Instead, it reflects a genuine gap between what Wall Street predicted and what companies actually delivered. The market has responded by repricing expectations upward in real time. The blended earnings growth rate—the aggregate earnings per share growth across all reporting companies—has risen to 15.1%, an uptick from just 13% recorded merely a week earlier.
Expectations are not just being met; they are being continuously revised higher as more evidence arrives.
Equally important is the fact that this outperformance is not confined to the bottom line. Traders and investors who focus exclusively on earnings-per-share improvements driven by aggressive cost-cutting often find themselves disappointed when the underlying economics of the business fail to support sustained growth. The risks of such a scenario diminish materially when the beats are accompanied by robust revenue growth.
In this quarter, that confirmation is present. Eighty-one percent of companies have beaten on sales, and revenue growth now stands at 10.3%, a figure representing the strongest top-line growth recorded since 2022.
Growth that is supported by expanding revenue, and not merely by cost discipline or financial engineering, suggests that underlying demand remains resilient. Customers are buying. Market share is shifting. The business cycle is expanding, not contracting beneath a veneer of profitability improvement.
For traders, it reduces the probability of a broad-based equity drawdown triggered by disappointing earnings in the weeks ahead. The bar has been set high, but companies appear capable of clearing it. However, it also shifts the market’s focus away from earnings as the primary variable and toward something more complex: the sustainability of valuation in a market where strong results are increasingly priced in.
The Illusion of Breadth: Why Sector Participation Masks a Dangerous Concentration
At first, this earnings season appears to confirm a healthy broadening of market leadership. Eight out of eleven sectors are delivering year-over-year earnings growth. Industrials are reporting solid increases. Financials are benefiting from a resilient economy. Materials are capturing commodity strength. Technology continues to grow.
Across the board, sectors are posting revenue expansion, suggesting that the growth story is not dependent on any single area of the economy or market.
This pattern of broad sector participation is, in traditional market analysis, considered a hallmark of a healthy and sustainable rally. When earnings growth is dispersed across the economy rather than concentrated in one or two outperforming names, the risk of a sharp reversal diminishes. Traders have long known that concentration breeds fragility; breadth builds strength.
But here is where the surface narrative breaks down entirely.
The real story of this earnings season is not simply the fact that multiple sectors are participating. It is “who” is driving the market at the margin. It is the question of which companies are moving the index itself, where the price discovery is actually occurring.
The cohort of companies known as the “Magnificent 7″—the seven largest technology and mega-cap companies—are collectively expected to deliver earnings growth of 22.8% in Q1. That figure is more than double the growth rate of the remaining 493 companies in the S&P 500 combined.
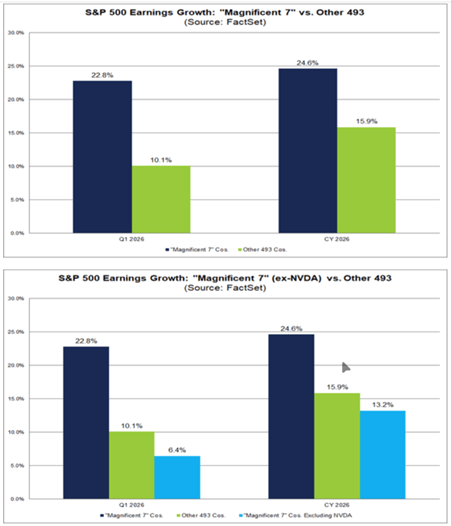
Source: FactSet
While this might suggest that mega-cap tech is simply outperforming the rest of the market, the reality is different.
Within that “Magnificent 7” group, the growth rate is heavily skewed by a single dominant name: NVIDIA. The artificial intelligence chip manufacturer has become the center of the entire equity market rally, and the earnings growth expectations for the group are disproportionately influenced by this single company’s trajectory.
Strip NVIDIA from the picture (remove it from the calculation entirely) and the remaining six companies in the “Magnificent 7” suddenly show earnings growth of just 6.4%. Meanwhile, the other 493 companies in the S&P 500 are growing earnings at 10.1%.
In other words, the market is no longer simply a mega-cap story. It has become, increasingly, a single-stock story embedded within mega-cap leadership. The index appears diversified when viewed from a sector perspective, but performance sensitivity is increasingly concentrated in companies that depend on artificial intelligence investment, and even more narrowly, in the companies that supply the hardware underpinning that investment.
For traders, this introduces a structural asymmetry. The S&P 500 appears to offer diversified exposure across multiple sectors and industries. Yet the actual driver of index returns is increasingly singular. This is not inherently bearish—concentrated leadership can persist for extended periods—but it is structurally fragile. When market leadership is concentrated, the margin of safety narrows. A single negative catalyst affecting the leading name can have outsized implications for the entire index.
Understanding this concentration risk is essential before we examine what valuations are actually pricing in—and whether current prices leave room for disappointment—in the next article.
Source: FactSet Insight
The information provided does not constitute investment research. The material has not been prepared in accordance with the legal requirements designed to promote the independence of investment research and as such is to be considered to be a marketing communication.
All information has been prepared by ActivTrades (“AT”). The information does not contain a record of AT’s prices, or an offer of or solicitation for a transaction in any financial instrument. No representation or warranty is given as to the accuracy or completeness of this information.
Any material provided does not have regard to the specific investment objective and financial situation of any person who may receive it. Past performance is not a reliable indicator of future performance. AT provides an execution-only service. Consequently, any person acting on the information provided does so at their own risk. Forecasts are not guarantees. Rates may change. Political risk is unpredictable. Central bank actions may vary. Platforms’ tools do not guarantee success.