Dark pool trading shows no sign of decline since MiFID II entry into force, ESMA data shows
The European Securities and Markets Authority (ESMA) today published its first statistical report on European Union (EU) securities markets. The Report aims to offer a comprehensive overview of European equity and bond markets in 2019, including the number, characteristics, volumes traded and transparency data on the equity and bond instruments subject to MiFID II.
European trading volumes amounted to EUR 27 trillion in equity markets and EUR 101 trillion in bond markets in 2019. These volumes were spread over 430 trading venues – 135 regulated markets (RM), 223 multilateral trading facilities (MTF) and 72 organised trading facilities (OTF). In addition, there were 216 systematic internalisers (SIs), with an increase of 47 SIs since the beginning of 2019.
In the latest years, a large proportion of equities trading in Europe has shifted from traditional platforms to new types of venues. The most traditional type of equity trading occurs on registered stock exchanges, also known as “lit markets”.
Due to the rapid technological change and to the evolving regulatory landscape, the demand for dark pools has increased since the introduction of MiFID I. Dark trading is defined as transactions executed under external reference prices, instead of prices based on the internal order book, negotiated trade and large-in-scale pre-trade transparency waivers.
There are several reasons why traders are willing to use dark pools, which include avoidance of information leakage, minimisation of market impact costs, and facilitation of the execution of large blocks which may be difficult to achieve on transparent markets due to a lack of depth in the orderbook.
To limit the amount of dark trading in equities and to ensure that the use of those waivers does not prevent the proper functioning of the price formation process, MiFID II introduced the double volume cap mechanism (DVC). This mechanism limits trading under the reference price waiver and the negotiated trade waiver in liquid instruments, when there is a concentration of dark trading volumes on a single trading venue, or when dark trading reaches a certain ceiling on EEA trading venues.
However, these limitations seem to have a little effect on dark pool trading.
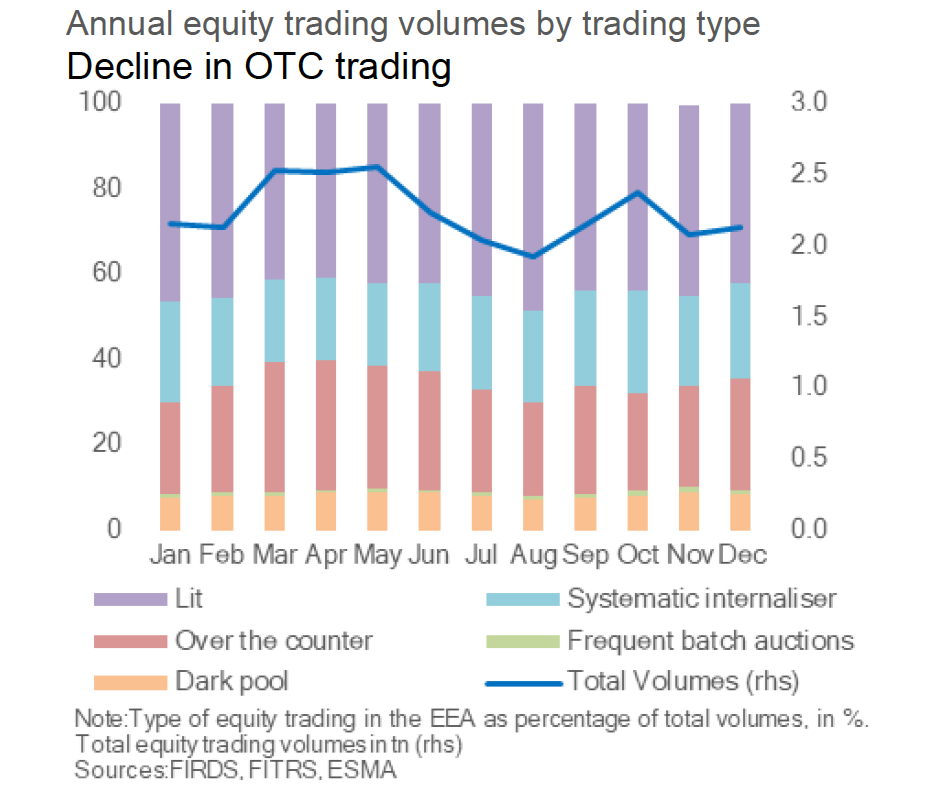
Overall, close to half of equity trading is carried out on lit markets (between 40 and 49% of the monthly volumes), and dark pool trading showed no sign of decline since the entry into force of MiFID II, accounting for 8% of total volumes in 2019.

Overall, in 2019, 28,000 equity and equity-like instruments were available for trading, of which 75% were shares, followed by exchange-traded funds (ETFs, 20%).
Shares amounted to 89% of equity trading volumes. While trading volumes of ETFs have grown, amounting to 10% of total trading in equity markets in 2019 (up from 6% in 2018). Trading volumes of equity instruments were evenly split between RMs (25%), MTFs (27%), SIs (21%) and over-the-counter (26%).
Over 170,000 bonds were available for trading in Europe in 2019, including 53% corporate and 5% sovereign bonds, and sovereign and corporate bond notional amounts were evenly split at EUR 10 trillion each.
Bond trading volumes (77% of volumes from sovereign and 18% from corporate bonds) were largely off-exchange (50% OTC, 26% SI, only 1% RM).


