


TradingView offers additional historical price data
TradingView continues to enhance its services. Today, it made an important announcement regarding historical price data.
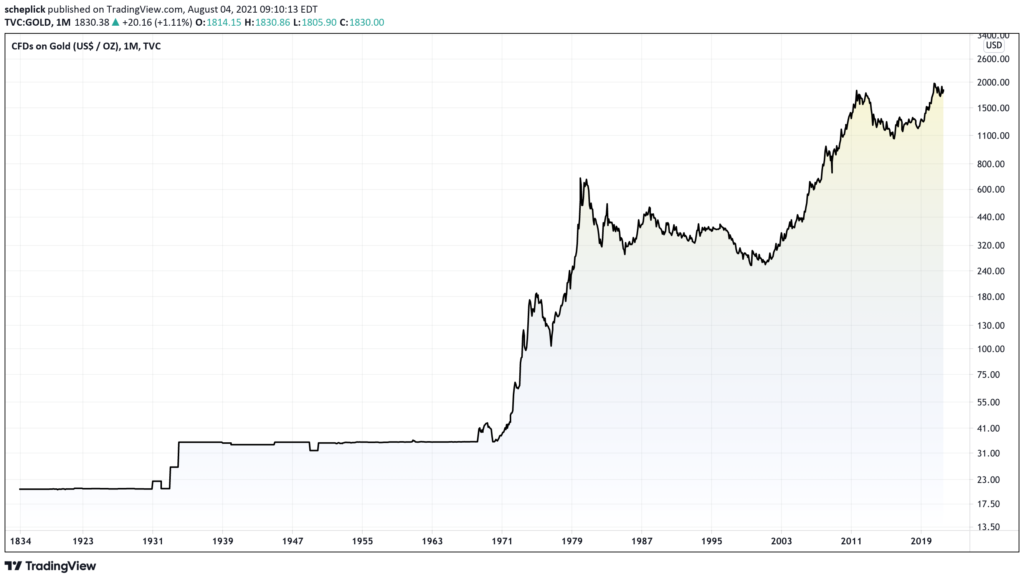
In the last few months, the TradingView team has found ways to add hundreds of years of data. For example, traders can now chart the price of Gold going back 187 years. They can also chart companies like Coca-Cola and IBM going back more than 50 years. Here are some more examples that are now available via TradingView:
- Dow Jones Industrial Average (Ticker: DJI) now has price history going back to 1896
- S&P 500 (Ticker: SPX) now has price history going back to 1871
- Bitcoin Index (Ticker: INDEX:BTCUSD) now has price history going back to 2010
- Gold (Ticker: GOLD) now has price history going back to 1833
- Coca-Cola (Ticker: KO) has price history that dates back to 1968
- Exxon (Ticker: XOM) has price history that dates back to 1968
- IBM (Ticker: IBM) has prices that dates back to 1968
- Oil (Ticker: USOIL) now has price history going back to 1861
- Silver (Ticker: SILVER) now has price history going back to 1802
- JP Morgan (Ticker: JPM) has price history that goes back to 1969.
To get started, type any of the following tickers into the TradingView search box i.e. “GOLD” or “SPX” or “KO”. Then select the asset and open the chart. From here, you can zoom out as needed to see its entire price history. Here is an example so you can see how it looks:
Speaking of data, let’s recall that traders can now take advantage of data from the Federal Reserve System on TradingView.
Federal Reserve data comprise over 815,000 time series from 107 sources. Although some of this data were already available to TradingView users, the number has now increased to 1,109 popular episodes.
All you need to do is use the “FRED:” prefix in the symbol search.


