Public.com attacks Robinhood and PFOF brokers with trade execution data
Social trading brokerage startup Public.com, in the news recently for engaging supermodel brand ambassadors, sports all-stars, and adding crypto trading, has issued a fairly interesting take on payment-for-order-flow, or PFOF. PFOF – which Public.com eschews – is a method by which most of Public.com’s competitors such as Robinhood make money, i.e. offering commission-free trades by selling customer order flow to institutional market makers.
Used by numerous US retail brokers but basically banned in Europe and Australia, there has been much debate in the online trading industry as to whether or not PFOF has been a net positive or negative for retail clients. Clearly though, the up-front no-commission fee deal has been very attractive to retail traders, and has attracted a lot of new/young traders to the industry and to specific brokerages offering the no-commission service.
Here is what Public.com COO Stephen Sikes had to say about PFOF, and some of its competitors’ claims.
Delivering on Price Execution Without PFOF
With aligned incentives, we’re improving price execution for our customers.
Earlier this year, we ended our participation in payment for order flow (“PFOF”). Today, we’re giving you a transparent view of how Public has been able to achieve excellent price execution for our members without relying on market makers or PFOF.
The takeaway: The data available to us strongly suggests that Public delivers better execution quality on average to customers than our peer firms that accept PFOF from market makers.
This conclusion is based on our own data and what our peers publish, but there are currently no standards for retail brokers to publish execution quality statistics. To lead with transparency, we’re measuring our equities price execution against the metrics shared by our peers and also explaining in detail what these metrics mean and how we view them.
Debating the role of PFOF in price execution
Rejecting PFOF marked our commitment to putting investors first by better aligning our business incentives with our customers’ best interests.
PFOF played an important role in making the public markets more accessible because it allowed brokerages to make money without charging commission fees. But since PFOF revenue increases with trade frequency, this model incentivizes brokerages to encourage more frequent trading. For the vast majority of retail investors, that means losing money.
PFOF persists because so many trading platforms rely on the revenue it generates. Defenders of PFOF have claimed that retail brokers who route to market makers (in exchange for PFOF) provide better price execution for investors and that it’s a net positive despite creating inherent misalignment between these platforms and their customers. Our data proves otherwise: quality price execution is possible without PFOF and without routing to market makers.
Transparent reporting absent an industry standard
Understanding the relationship between PFOF and execution quality is difficult since there is no industry-wide standard for reporting execution quality by retail brokers. A limited number of retail brokers publish execution metrics and those that do use different metrics that are not always clearly defined. The result: it’s nearly impossible for investors to compare execution quality across retail brokerages.
To lead with transparency, we’ve measured our equities price execution against the metrics shared by some of our peers. As the data below shows, Public’s PFOF-free order routing model achieves prices for our customer orders that are on par with, if not better than, pricing we see from peers in the industry that take money from order flow.
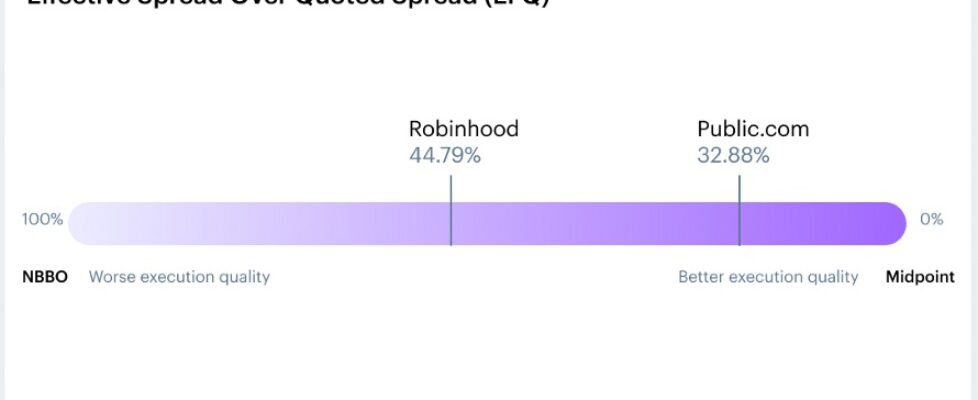
Effective spread over quoted spread (EFQ)
At Public, we optimize for effective spread over quoted spread (“EFQ”), which represents how much price improvement an order received (specifically, how close to the “midpoint” of the NBBO an order was executed). The lower the EFQ percentage, the closer it is to the midpoint and therefore the better its execution quality.
We believe that EFQ is the most comprehensive and important metric for understanding the quality of prices delivered. The impacts of other metrics published by our peers, like AOB and Price Improvement, are naturally reflected in EFQ.
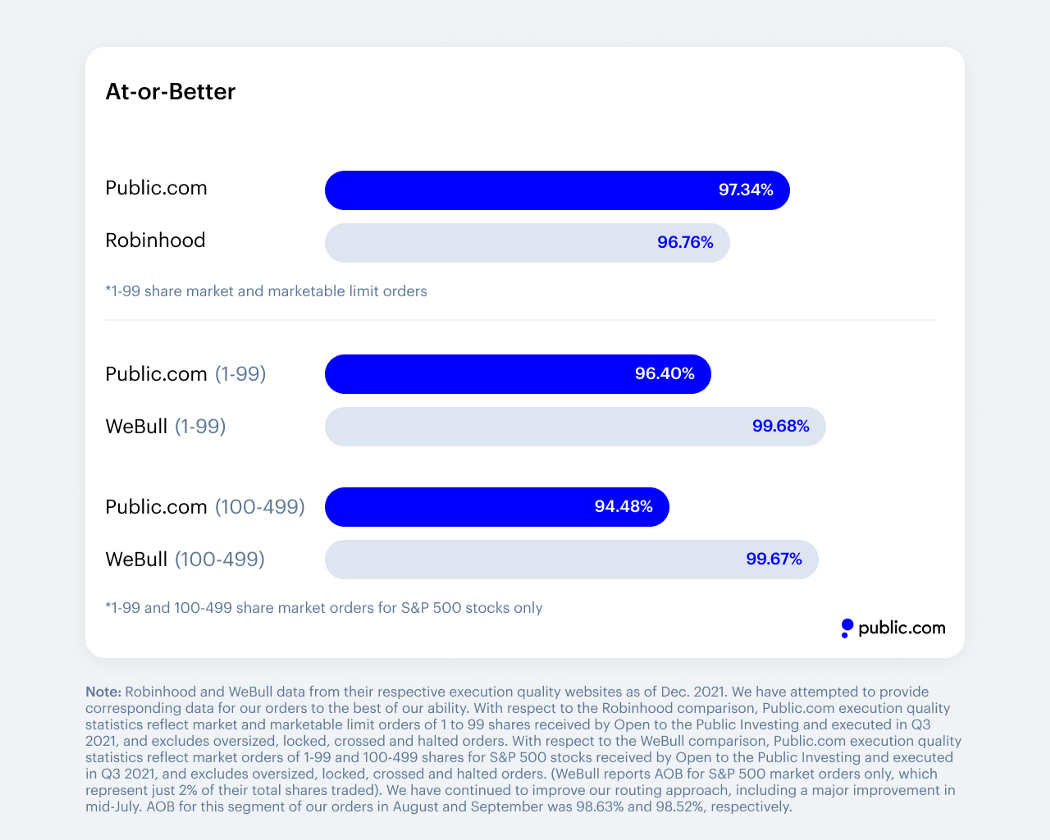
Outside of EFQ, we understand that some of our peers report on different metrics so the below data shows how we compared to their Q3 reporting.
At-or-Better (AOB)
AOB reflects the percent of shares that are executed at or better than the NBBO at the time of order submission. The higher the AOB percentage, the more total trades are executed at least at the NBBO for customers.
Gross price improvement
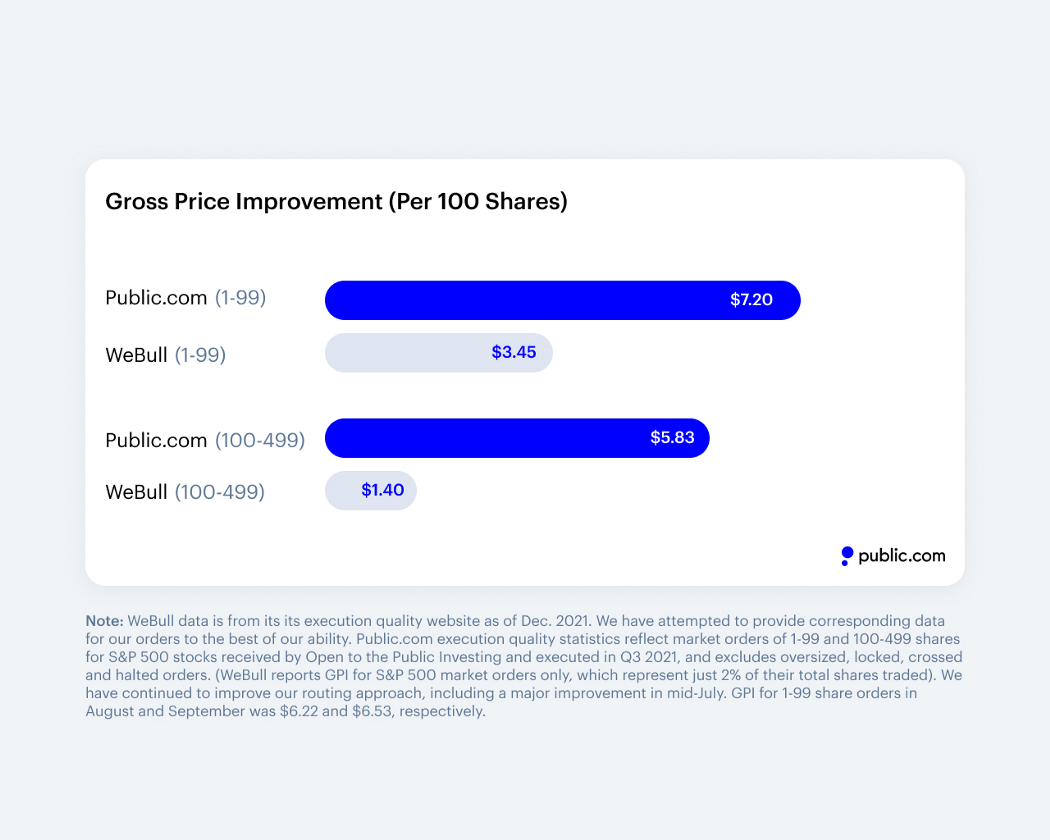
Gross price improvement is the notional amount of price improvement received on shares executed at a price better than the National Best Bid and Offer (“NBBO”).
Net price improvement
Some platforms also share net price improvement, which is measured by taking the gross price improvement per share and subtracting any executions that slip outside of NBBO, then averaging that across all shares traded.
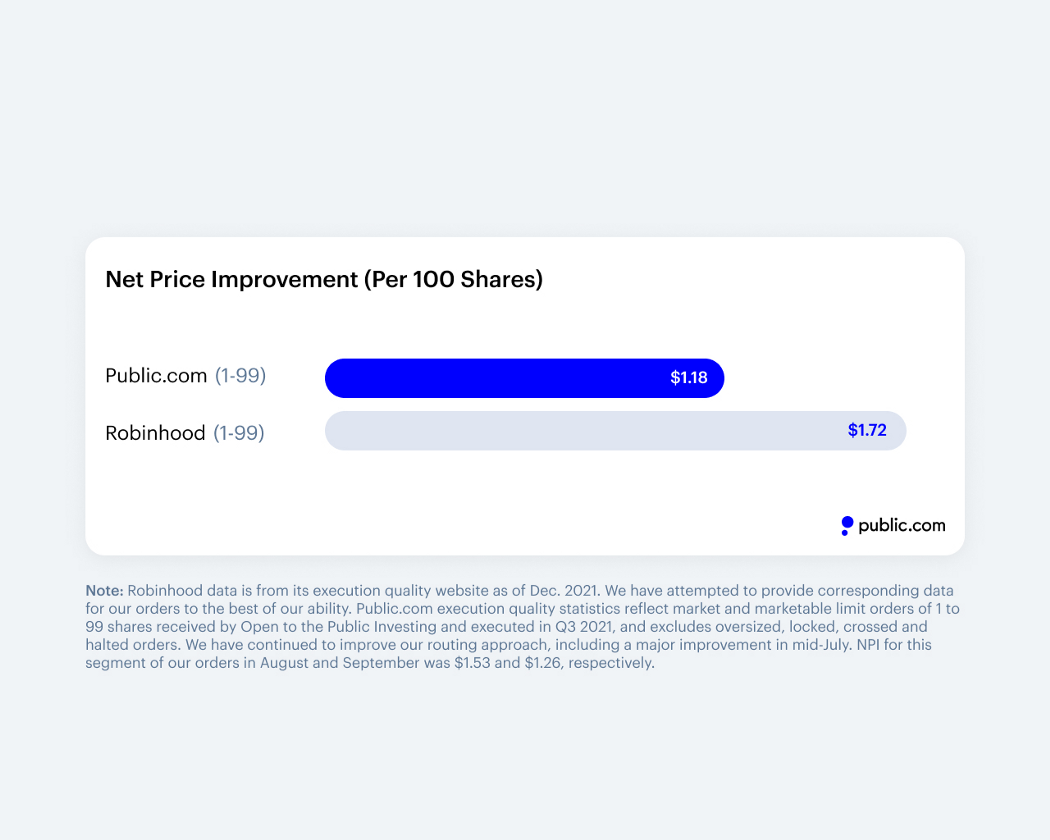
Public’s lower Q3 net price improvement number — when paired with a superior EFQ — primarily indicates that Public’s customers traded stocks with narrower spreads, on average.
Bottom line: Rejecting PFOF allows us to deliver better price execution.
Looking at the data across EFQ, AOB, and price improvement per share, it’s clear that quality price execution is possible without routing to market makers in exchange for PFOF. Public’s price execution on the most comprehensive and important metric, EFQ, is better than our peers and is comparable, if not better, across the other metrics.
Returning value to retail investors
The execution of retail investing orders represent a multibillion-dollar industry in which different parts of the ecosystem capture a percentage of the value created by these orders (where the “value” of an order is defined as the “spread” or the distance between the midpoint of the NBBO and the best bid or offer). In the PFOF system, a significant share of order value goes to brokers via payment for order flow revenue and market makers via profits.
Bloomberg Intelligence calculated that in the second quarter of 2021, the spread between the midpoint and the best bid or offer on retail investing orders was divided as follows:
- 49% went to market makers in the form of trading revenue
- 13% went to brokers in the form of PFOF
- 38% went to retail investors in the form of price improvement
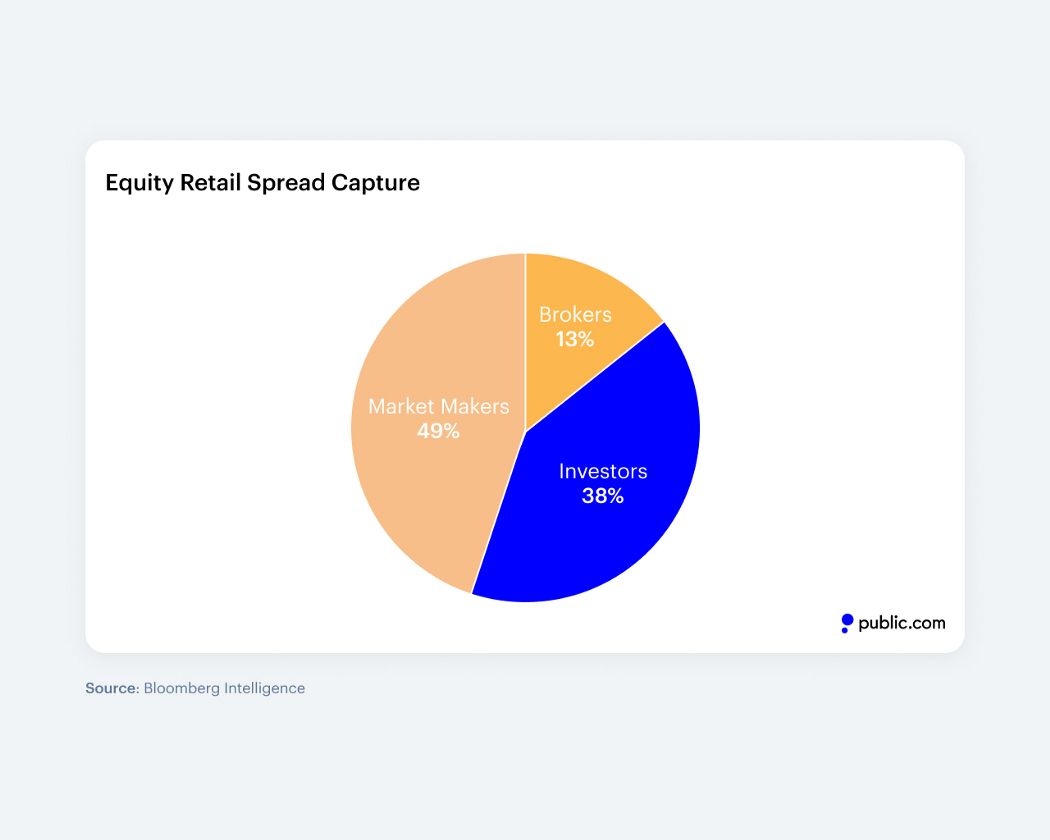
What’s left of the value — after profits to market makers and payment for order flow revenue to brokers — goes to retail investors in the form of price improvement. The more value or share of the spread that goes to brokers and market makers, the less room there is for price improvement for customers.
Without relying on PFOF, Public’s model delivers better execution quality on average, which means more value goes directly to our customers.
So, how are we doing it? We’ve found a different way to execute that delivers better pricing to investors, and puts their priorities first.
How it works within the PFOF model
There are three types of market centers where retail brokers can route orders for execution: exchanges, alternative trading systems, and market makers.
Most retail brokers route their customer orders to a small number of market makers, who pay the broker PFOF in exchange for order flow. These brokers typically use a “directed” routing model in which they allocate orders to each market maker based on pre-set criteria, including historical execution performance. So, when a customer submits an order to the broker, the broker assigns that order to a predetermined market maker, without checking the broader market for a better price.
The market maker has significant discretion on what price to deliver for an order, as long as that price is at or better than the National Best Bid and Offer (NBBO). Every dollar they deliver in extra price improvement is a dollar less they earn on that trade, so their incentives are to deliver a price that is just good enough to retain the contract with the broker, but may not be as good as other pricing that is available in the market.
NBBO comes with limitations because it only captures 50% to 60% of the pricing available in the market. NBBO only includes pricing that is available on the displayed liquidity on formal National Securities Exchanges (sometimes called “lit” exchanges) for certain types of orders and only for orders of more than 100 shares. It does not include any prices available outside of the “lit” exchange market. Oftentimes, and particularly for orders of less than 100 shares, there are better prices available in the market than what is captured by NBBO. Our model accounts for this gap.
Public’s model: Best possible, order-by-order
In the PFOF system, it’s logical to see how market makers would want to give a price that’s narrowly better than the NBBO price. Moreover, customers never have the chance to get a better price that could very well — and often does — exist outside of the parameters of NBBO.
We want our customers to get the best possible price on every single order. So, working with our partners at Apex Clearing, Instinet and the execution venues, we use smart order routing (“SOR”) software to locate the best price for each order available across 28 different lit exchanges and alternative trading systems (“ATSs”), and then route that order to the venue that offers the best price.
When a customer submits an order to Public, the SOR first tries to execute that order at the “midpoint” price that is halfway between the Best Bid and Best Offer by scanning venues that are often not included in NBBO, including retail-specific lit venues and alternative trading systems that are designed to pair natural buyers and sellers at the midpoint.
If we are unable to find a NBBO midpoint (or similar) execution during this first sweep, we route to the exchange with the best available posted price (often called the “inside quote”) as well as the highest likelihood of executing the order at or better than the NBBO. Most often, these are high-quality lit exchanges, including Nasdaq and IEX.
We currently execute across 28 different venues and execute 70–75% of our shares on lit exchanges. We execute the remainder on ATS, almost entirely in cases when we are able to find a midpoint execution that is better than we’d find on the lit exchanges.
This approach is working. We’re able to deliver better prices for our investors, in aggregate, than the PFOF-based model. This is based largely on delivering significantly better prices for a meaningful percentage of our investors’ orders.
****
Improving price execution relative to industry standards was a big focus for the team in 2021, and we’re proud of what we were able to accomplish thus far.
With that, the work isn’t over and we’ll continue to optimize this approach to deliver the best possible prices on an order-by-order basis. We expect to continue to improve upon these results and we commit to sharing transparent updates along the way.

