TradingView introduces Economic Charts
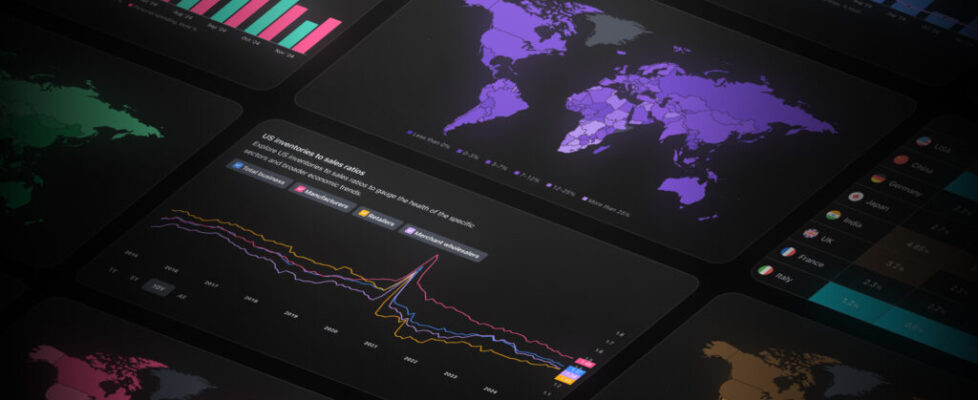
TradingView enables traders to dig deeper into the global economic trends with a brand-new section on TradingView – Economic Charts.
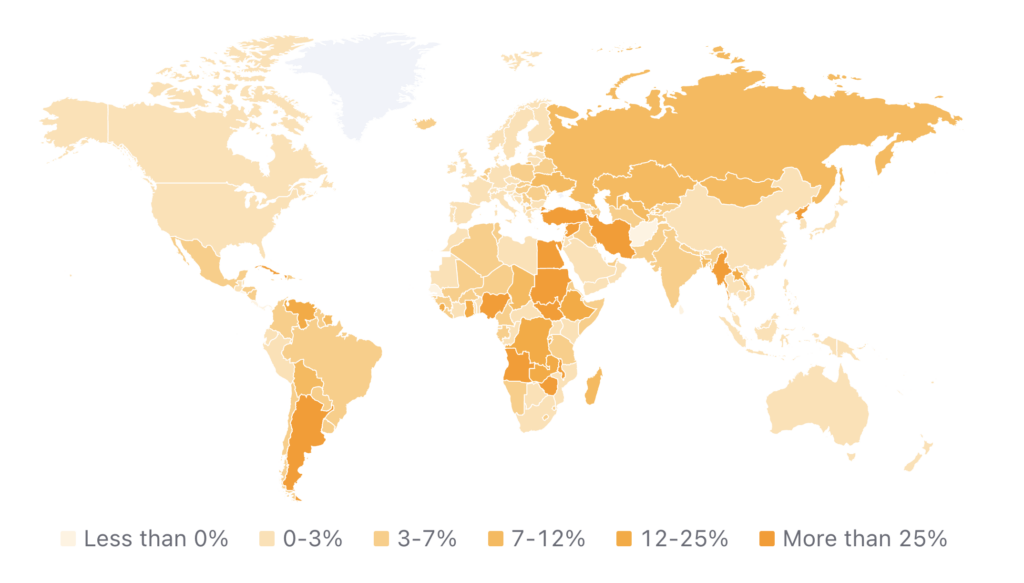
TradingView users can explore detailed charts and maps of key economic indicators for major countries to understand trends in the global economy. They can see which country has the highest inflation or GDP growth in clear visuals for informed decision-making.

The 10 new pages will allow you to:
- Explore inflation dynamics with Global inflation heatmap.
- Get a grasp on global unemployment on the employment overview.
- Monitor consumer behavior dynamics to anticipate trends.
- Spot global trends in production and business.
- Analyze major countries’ debt.
- Gain insights into GDP growth and various recession indicators via the Economic growth page.
- Study central bank rates, gold reserves, and other key metrics in the bank and financial system overview.
- Check the charts to analyze the housing situation and real estate market in the US, including mortgage rates, home sales, prices, and more.
- Enrich your strategy with US balance of trade, debt and income data in the Trade and capital movements section.


