TradingView adds new Volume Profile Periodic Volume indicator
TradingView has introduced a new indicator – Volume Profile Periodic Volume (VPPV) which allows building volume profiles for periods longer than one trading day.
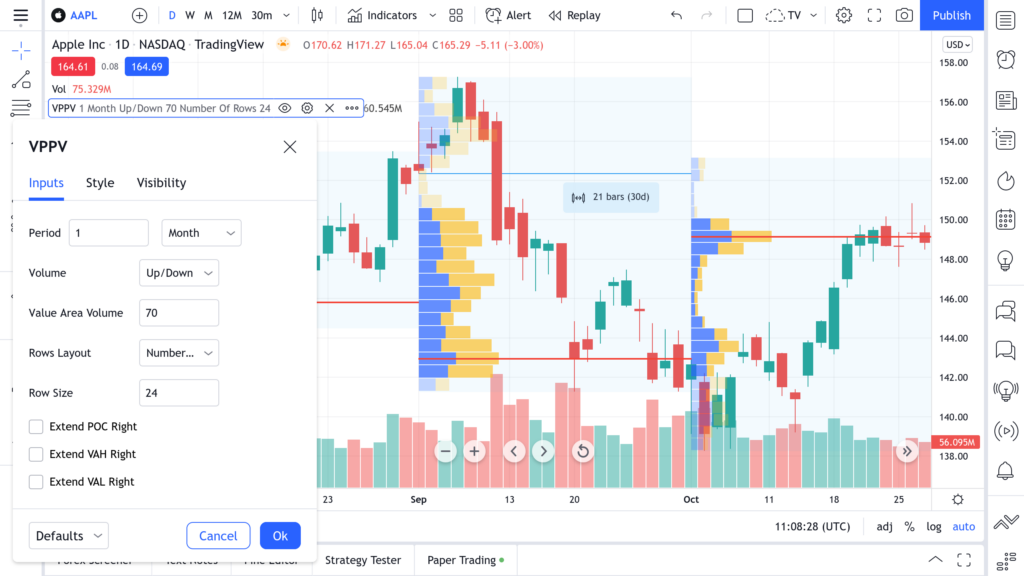
The indicator builds one general volume profile for each new period, set by the user through the “Period” input parameter. The period multiplier is set in the first field, and the period itself, which can take the values “Day”, “Week” or “Month”, is set in the second field.
For example, if you set 1 Month as the input parameter for “Period”, then each volume profile plotted on the chart will include the volumes of all trades from the first to the last day of every available month.

For all Volume Profile indicators, TradingView has added the ability to display the upper (VAH) and lower (VAL) boundaries of the value area on the chart. These lines provide a convenient visual representation of the boundary values of the value area, in which N% of all transactions are made for the specified period. The Value Area High and Value Area Low lines are located approximately at the price level that is the maximum allowable for making buy or sell transactions for N% of traders, where N corresponds to the Value Area Volume input parameter.
For VPPV, VPSV, and VPSV HD, it is now possible to extend the Point of Control, Value Area High or Value Area Low lines to their intersection with the nearest bar, which makes it easier to visually identify the breakdown of these levels.
Finally, the Volume Profile Fixed Range indicator now has the Extend Right input parameter, which disables the right boundary of the calculation. When you add this indicator to the chart, you first specify a fixed period of two coordinates: the start and the end of the profile. The indicator is then built based on the data for this specified period only.
The new input parameter Extend Right allows you to continue building the profile, including all historical candles and all new emerging candles to the right of the second coordinate.


