

Latest MT5 mobile app release for iPhone/iPad offers trading report and additional indicators
The latest version of the MetaTrader 5 mobile app for iOS-based devices introduce a range of new features designed to help traders stay abreast of financial markets wherever they are.
The developers have added a report representing trading results in a convenient visual format. It assists in evaluating trading performance, optimizing portfolios and finding methods to achieve lower risks along with improved trading stability.
To analyze your strategy, go to the history section and tap the period selection icon. Next, select the period and tap “Create a trade report”.
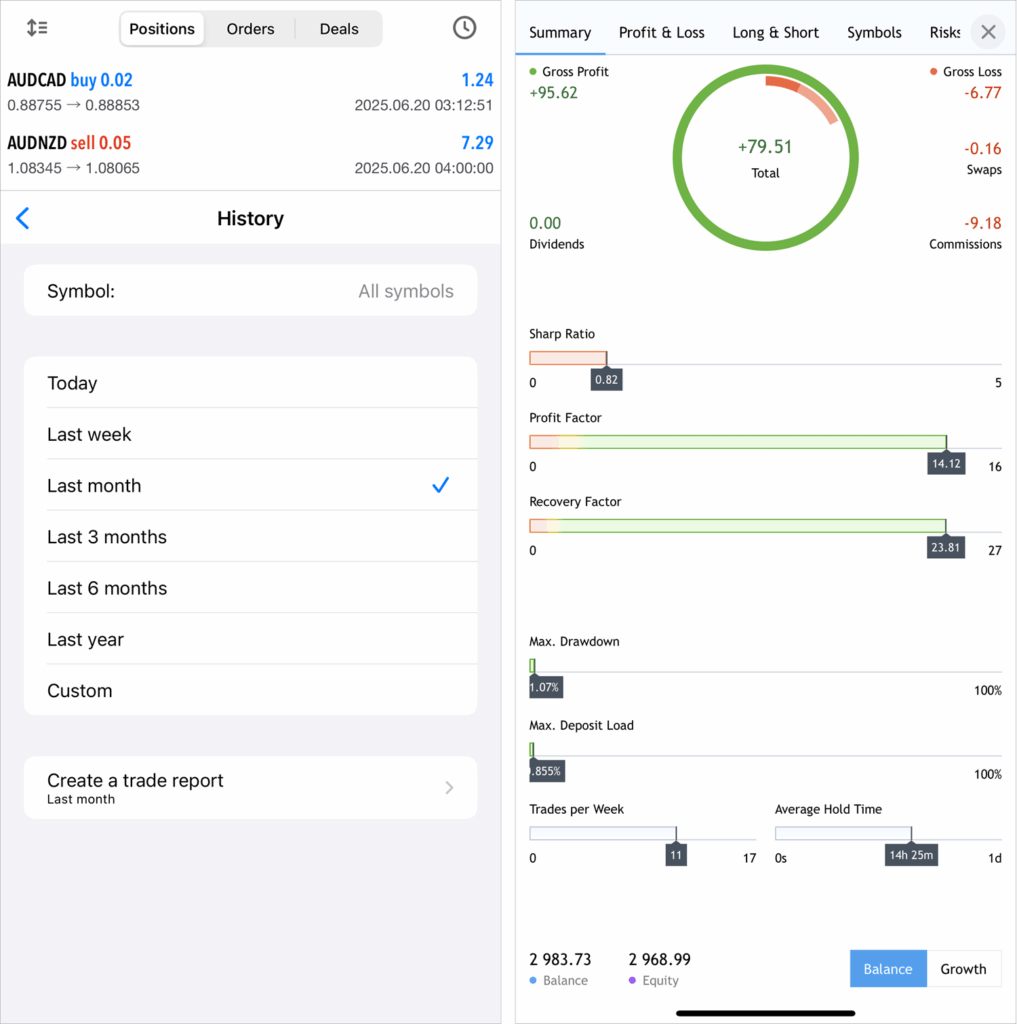
The report is divided into tabs, each providing aggregated information:
- Summary — an overview of trading over time: overall profit and loss metrics, deposit and withdrawal amounts, balance, growth and dividends graphs, and other trading results.
- Profit/Loss — data on profitable and losing trades. The parameter is divided by types of trading (manual, algorithmic and copying trades). The results can be analyzed in terms of trades or money by months and years.
- Long/Short — dynamic ratio of purchases and sales at specified periods of time, as well as Buy and Sell profitability.
- Symbols — analysis of trades by financial instruments. Here you will see which symbols you earn or lose on, how often you trade them, graphs of trades and monetary volumes for them.
- Risks — key risk characteristics of your strategy: drawdown and deposit load graphs, and the ratio of profitable and losing trades.
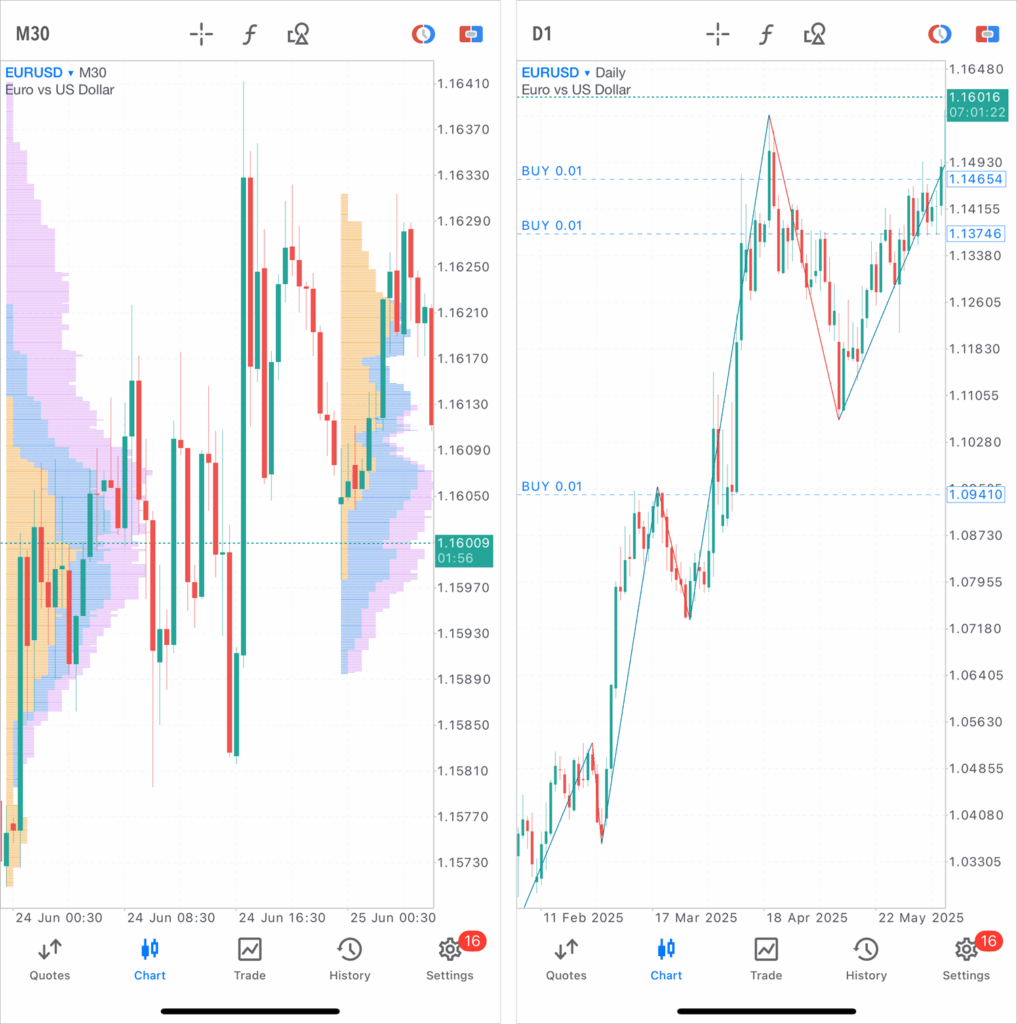
The platform now offers ZigZag and Market Profile indicators, as well as a new chart type — Heikin Ashi. These tools will enhance market analysis and trend identification.
To add new indicators, open the chart menu, tap Main window and select them from the list. ZigZag is found under trend indicators, while Market Profile belongs to volume indicators.
Deal info has been added to the Data Window. When hovering the crosshair over a bar containing deals, the Data Window will show general info about the transaction: direction, ticket, volume, price and financial result, along with prices and indicator values.
Traders can now make use of a quick mode for displaying the Data Window on a chart. Tap and hold the main chart for over a second to enable the crosshair mode together with the Data Window. As soon as you release your finger, the chart returns to normal mode. This allows for quick view of the exact values of bars, indicators and deals without switching to crosshair mode via the top panel.
The developers have also added a separate command for resizing and reordering additional indicator windows. The same action can be performed by long pressing the indicator subwindow on the chart. Also, the subwindow editing mode itself has been enhanced with additional icons for clarity.
The trading history display on the chart has been improved. The application can now display thousands of deals without significant performance degradation.