

S&P 500 Forward P/E Falls to Three-Year Low: Is the Valuation Reset Creating an Opportunity or Signalling More Risks?

The following is a guest editorial courtesy of Carolane de Palmas, Markets Analyst at Retail FX and CFDs broker ActivTrades.
The S&P 500’s valuation has undergone a significant adjustment in 2026, with its forward price-to-earnings (P/E) ratio falling to its lowest level in more than three years last week. However, unlike previous periods when declining valuations reflected deteriorating corporate earnings expectations, the latest adjustment has largely been driven by stronger profit forecasts. This creates an interesting divergence: while analysts continue to raise earnings estimates, investors are becoming less willing to pay a premium for future profits.
The development comes as the US stock market faces renewed selling pressure following its October record highs. With the third-quarter earnings season delivering substantial growth but the S&P 500 struggling to regain upward momentum, investors must assess whether the valuation adjustment offers a more attractive entry point or whether further downside risks remain.
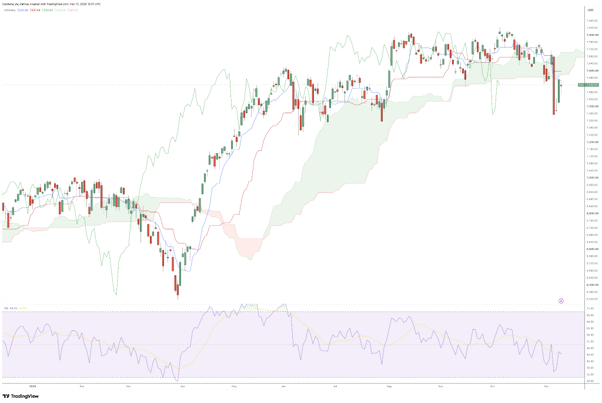
S&P500 Daily Chart – Source: TradingView
S&P 500 valuation falls below its five- and ten-year averages
According to FactSet, the S&P 500’s forward 12-month P/E ratio stood at 17.7 on November 5, based on an index closing level of 7,353.73 and expected earnings per share (EPS) of $415.82. This represented its lowest valuation since November 1, 2023, when the ratio reached 17.5.
The latest reading also places the index below its five-year average of 19.8 and ten-year average of 19.1. However, the comparison looks different over longer periods. The current multiple remains slightly above its 15-year average of 17.6 and more comfortably above its 20-year and 25-year averages of 16.5 and 16.4, respectively.
This distinction matters. Although the S&P 500 has become less expensive relative to its recent history, its valuation is not exceptionally low when assessed over several decades. More importantly, the decline in the forward P/E ratio has not primarily resulted from a collapse in share prices. At the end of 2025, the index’s forward multiple was 22.0. Since then, the S&P 500 has gained 7.4% as of the end of last week, while its estimated forward 12-month EPS has increased by 33.6%.
In other words, projected earnings have grown considerably faster than share prices, reducing the amount investors are paying for each dollar of expected corporate profit. This is a fundamentally different situation from a conventional valuation correction, in which falling stock prices drive multiples lower while earnings forecasts deteriorate simultaneously.
The adjustment has not been uniform across sectors, either. On November 5, Information Technology and Energy were the only two sectors trading below their respective 25-year average forward P/E ratios. Technology’s multiple stood at 17.3, compared with its historical average of 20.0, while Energy traded at 11.7 against an average of 13.9. The technology sector’s valuation was also at its lowest level since March 2020.
Strong earnings growth provides fundamental support
The improvement in earnings expectations is supported by the latest corporate results. According to FactSet’s November 6 earnings season update, 88% of S&P 500 companies had reported their third-quarter results. Of these, 84% had exceeded analysts’ EPS estimates, above the five-year average of 78% and the ten-year average of 77%. However, the size of these positive surprises has been more modest. Aggregate earnings were 2.7% above expectations, compared with historical averages of 7.5% over five years and 8.0% over ten years.
Despite this relatively limited earnings beat, the index’s blended Q3 earnings growth rate reached 31.4%, up from 29.1% at the end of September. If maintained, this would mark the third consecutive quarter of earnings growth exceeding 25%. All eleven sectors are reporting positive year-over-year earnings growth, with Energy, Information Technology and Materials leading the expansion. Revenue growth has also been encouraging: the blended growth rate reached 14.3%, compared with 12.2% at the end of the quarter.
The figures suggest that corporate profitability is holding up, although the relatively small earnings surprises indicate that companies are finding it harder to outperform already elevated expectations.
Another encouraging development comes from analyst revisions. FactSet reported that fourth-quarter bottom-up EPS estimates increased by 1.4% between September 30 and October 29, reaching $94.79. This is notable because analysts typically reduce their forecasts during the first month of a new quarter. Over the past five years, the average revision has been a 1.1% decline. This was the third consecutive quarter in which analysts increased their estimates during the first month of the reporting period. For the full year, the bottom-up EPS forecast also rose by 0.6% in October, reaching $363.94.
Nevertheless, the improvement remains uneven. Energy recorded the strongest increase in fourth-quarter earnings estimates, at 20.3%, while Consumer Staples experienced a 4.0% reduction. Investors will therefore need to distinguish between broad-based earnings resilience and growth concentrated in selected industries.
Historical corrections offer a useful comparison, but not a prediction
The latest valuation adjustment can be compared with previous periods of declining S&P 500 multiples, although the underlying circumstances are different.
In 2022, the combination of persistent inflation, aggressive Federal Reserve tightening and recession concerns triggered a substantial repricing of US equities. By May 12, 2022, FactSet calculated the index’s forward P/E at 16.6, below its five- and ten-year averages. However, the mechanism behind the decline was different from the current situation. Between January 3 and May 12, 2022, the S&P 500 lost 17.5%, while forward EPS estimates actually increased by 6.1%. Falling share prices, rather than stronger earnings projections, were therefore responsible for the lower valuation multiple.
The 2020 market shock provides another example. As the COVID-19 pandemic triggered an abrupt economic shutdown, the S&P 500’s forward P/E fell to 13.1 on March 23, according to FactSet. This was a much more severe valuation contraction than the current 17.7 reading. The subsequent recovery was supported by extraordinary monetary and fiscal stimulus, as well as improving expectations for corporate earnings.
The longer-term comparison is equally important. During the 2008 financial crisis, the S&P 500’s forward P/E eventually dropped to 8.6, illustrating how far valuations can contract when earnings, credit conditions and economic confidence deteriorate simultaneously.
These episodes should not be interpreted as direct templates for the current market. Instead, they demonstrate that a lower P/E ratio does not necessarily mean that equities have reached a bottom. The sustainability of earnings forecasts and the economic environment remain crucial.
Technical weakness puts the earnings outlook to the test
Despite the relatively resilient corporate backdrop, the S&P 500’s price action has become less convincing. In a November 11 technical analysis, Reuters highlighted a succession of lower highs and lower lows since the index’s October peak, suggesting that sellers have gained control of the short-term trend.
According to Reuters, the index had retreated by approximately 4% from its record, approaching its 200-day moving average at 7,331. A sustained break below this level could expose the 7,237–7,313 support area. If this zone fails, the next significant downside area lies between 7,080 and 6,900. Conversely, a recovery above 7,578 could bring the 100-day moving average, near 7,620 back into focus. A move above 7,715.57 would also challenge the sequence of lower highs.
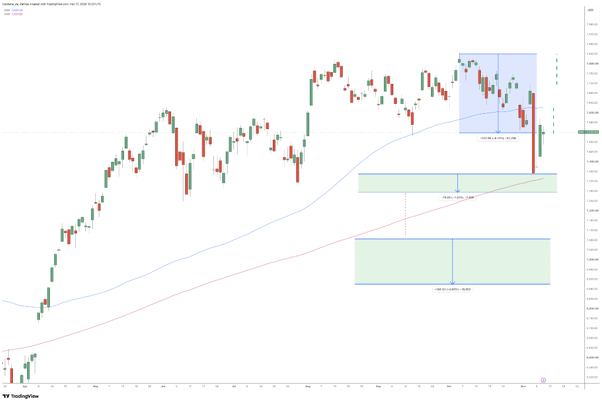
Daily S&P500 Daily Chart – Source: TradingView
For investors, the key question is whether improving earnings can offset the pressure created by weaker market sentiment and changing valuation expectations. The S&P 500’s lower forward P/E ratio offers some evidence that valuations have become more reasonable relative to expected profits. However, the index remains above its longer-term historical averages, while technical weakness suggests that the correction may not yet be over.
Ultimately, the next direction will depend on whether companies can continue delivering earnings growth at the pace currently anticipated by analysts. If profit estimates remain resilient, the recent valuation adjustment could provide a foundation for renewed market strength. If expectations begin to deteriorate, however, the current multiple may offer less protection than investors hope.
Sources: Reuters, FactSet, SP Global, JP Morgan, Yahoo Finance
The information provided does not constitute investment research. The material has not been prepared in accordance with the legal requirements designed to promote the independence of investment research and as such is to be considered to be a marketing communication.
All information has been prepared by ActivTrades (“AT”). The information does not contain a record of AT’s prices, or an offer of or solicitation for a transaction in any financial instrument. No representation or warranty is given as to the accuracy or completeness of this information.
Any material provided does not have regard to the specific investment objective and financial situation of any person who may receive it. Past performance is not a reliable indicator of future performance. AT provides an execution-only service. Consequently, any person acting on the information provided does so at their own risk. Forecasts are not guarantees. Rates may change. Political risk is unpredictable. Central bank actions may vary. Platforms’ tools do not guarantee success.