
Admirals hits multi-year low with Revenues (€13M) down 19% and a Net Loss of €6M in H1 2025
Things seem to have gone from bad to worse at Estonia based Retail FX and CFDs broker Admirals Group AS.
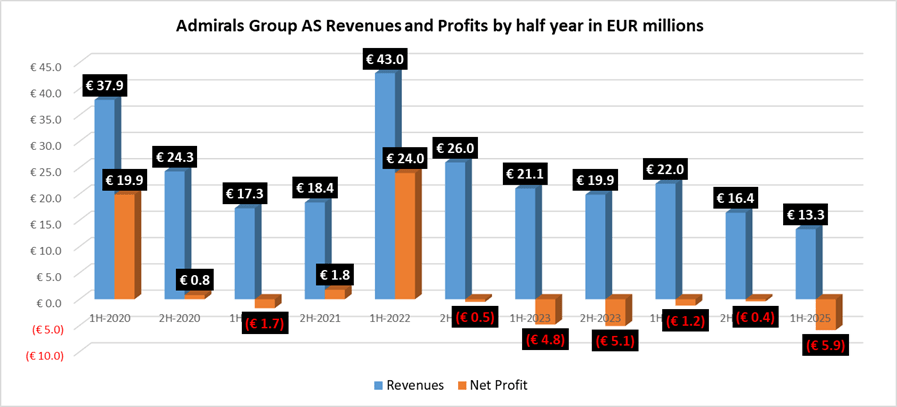
After posting multi-year lows in Revenues in the second half of 2024, although operating near breakeven, Admirals saw a further 19% decline in Revenue to just €13.3 million (USD $15.5 million) in the first half of 2025. As recently as H1 2022, Admirals was doing more than €40 million in semi-annual Revenues.
On the bottom line, Admirals posted a Net Loss of €5.9 million ($6.9 million) in H1 2025, its worst result since we began tracking data for the company in 2020.
In a brief statement, Admirals described the first half of 2025 as a period “marked by lower client trading activity in the Group’s core European markets”, saying that the company demonstrated its “commitment to operational discipline and strategic realignment.”
In 2024, Admirals voluntarily suspended the onboarding of new European clients for Admirals Europe Ltd, in alignment with recommendations from the CySEC regulator in Cyprus. After implementing all required measures, Admirals resumed client onboarding in the EU in March 2025, re-engaging with a key market. Admirals said that user acquisition efforts intensified in the second quarter of 2025.
Admirals Group AS’s H1 2025 income statement and balance sheet follow below.
Statement of Financial Position
| (in thousands of euros) | 30.06.2025 | 31.12.2024 |
| Assets | ||
| Cash and cash equivalents | 41,906 | 41,607 |
| Due from investment companies | 16,935 | 18,736 |
| Financial assets at fair value through profit or loss | 910 | 1,228 |
| Loans and receivables | 4,320 | 8,315 |
| Inventories | 259 | 665 |
| Other assets | 2,099 | 2,092 |
| Tangible fixed assets | 1,449 | 1,359 |
| Right-of-use assets | 2,077 | 2,541 |
| Intangible assets | 2,651 | 3,304 |
| Total assets | 72,606 | 79,847 |
| Liabilities | ||
| Financial liabilities at fair value through profit or loss | 328 | 334 |
| Liabilities and accruals | 3,206 | 3,326 |
| Deferred tax liability | 0 | 0 |
| Subordinated debt securities | 4,104 | 4,103 |
| Lease liabilities | 2,351 | 2,818 |
| Total liabilities | 9,989 | 10,581 |
| Equity | ||
| Share capital | 250 | 250 |
| Own shares | -956 | -456 |
| Statutory reserve capital | 25 | 25 |
| Currency translation reserve | -756 | 30 |
| Retained earnings | 64,054 | 69,417 |
| Total equity attributable to owners of the parent | 62,617 | 69,266 |
| Non-controlling interest | 0 | 0 |
| Total equity | 62,617 | 69,266 |
| Total liabilities and equity | 72,606 | 79,847 |
Statement of Comprehensive Income
| (in thousands of euros) | 30.06.2025 | 30.06.2024 |
| Net gains from trading of financial assets at fair value through profit or loss with clients and liquidity providers | 14,125 | 23,003 |
| Brokerage and commission fee revenue | 593 | 785 |
| Brokerage and commission fee expense | -1,365 | -1,793 |
| Other trading activity related income | 159 | 290 |
| Other trading activity related expense | -195 | -324 |
| Net income from trading | 13,317 | 21,961 |
| Other income similar to interest | 0 | 37 |
| Interest income calculated using the effective interest method | 827 | 467 |
| Interest expense | -233 | -234 |
| Other income | 195 | 261 |
| Other expenses | -384 | -264 |
| Net losses on exchange rate changes | -1,257 | -488 |
| Profit / (loss) from financial assets at fair value through profit or loss | 0 | -145 |
| Personnel expenses | -6,147 | -7,064 |
| Operating expenses | -10,716 | -13,864 |
| Depreciation of tangible and intangible assets | -1,074 | -1,406 |
| Depreciation of right-of-use assets | -380 | -392 |
| (Loss) before income tax | -5,852 | -1,131 |
| Income tax | -12 | -21 |
| (Loss) for the reporting period | -5,864 | -1,152 |
| Other comprehensive income / (loss): | ||
| Items that subsequently may be reclassified to profit or loss: | ||
| Currency translation adjustment | -786 | 470 |
| Total other comprehensive income / (loss) for the reporting period | -786 | 470 |
| Total comprehensive (loss) / income for the reporting period | -6,650 | -682 |
| Net (loss) attributable to the owners of the parent | -5,863 | -1,170 |
| Net profit attributable to non-controlling interest | 0 | 19 |
| (Loss) for the reporting period | -5,863 | -1,151 |
| Total comprehensive (loss) attributable to the owners of the parent | -5,863 | -700 |
| Total comprehensive income attributable non- controlling interest | 0 | 19 |
| Total comprehensive (loss) for the reporting period | -5,863 | -681 |
| Basic and diluted earnings per share | -2.38 | -0.47 |