Saxo Bank adds Historical Volatility Chart, Net Greeks Exposure to platforms
Online trading and investment specialist Saxo Bank has enhanced its trading platforms.
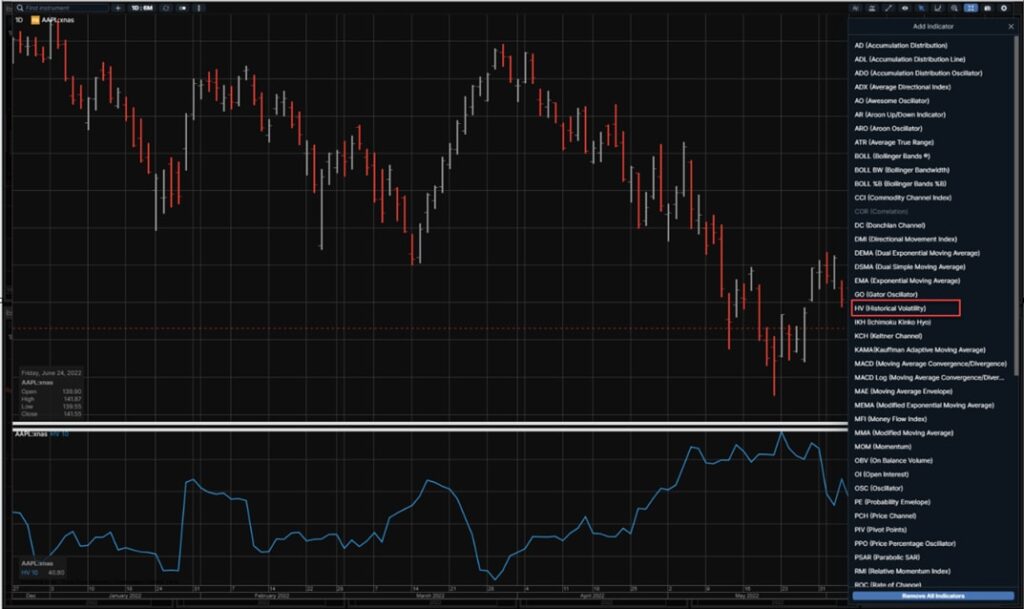
Historical Volatility Chart can now be found in the Technical Indicators menu. You can configure the period and the annual factor on the set up menu.

By default the “Period” is 10 for example 10 days if you are on a Daily Chart but you can change it to whatever period you wish like 20, 30. By default the Annual Factor is 260 like on a Bloomberg terminal but you can change it to whatever value you wish.
That feature is available on all trading platforms.
Saxo has released Net Greeks Exposure in the Position module for its most advanced clients.

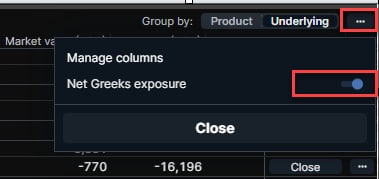
From the context menu in the Positions module click on the toggle Net Greeks Exposure. If the client has enabled the Greeks columns in the Positions module, the client will now see the Net Greeks Exposure per underlying.
This feature is available on SaxoTraderGO and SaxoTraderPRO but not on SaxoInvestor.
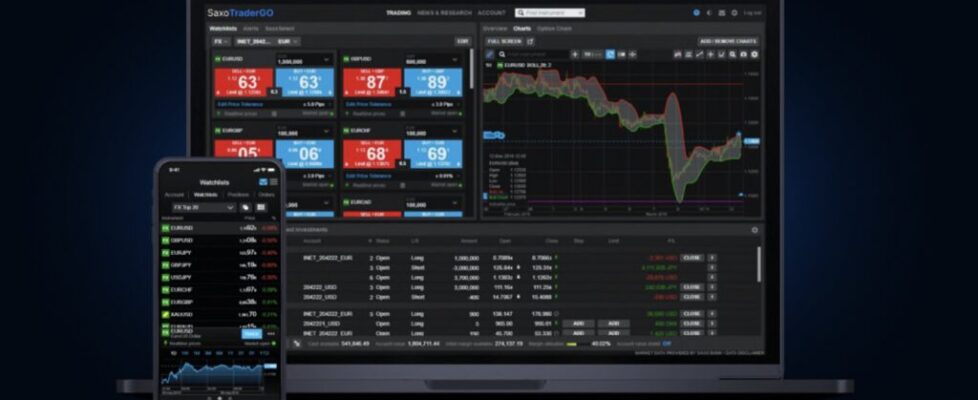
Saxo has regularly updates its platforms. The calendar on SaxoTraderGO has recently been replaced by a new and improved calendar module on desktop and mobile that now allows you to filter events based on time periods, countries, and event types such as macro, earnings, or dividends.
Other enhancements in the calendar module are comprised of a keyword search functionality and an increased future time range. Finally, Saxo has also updated the module with a more detailed screen that allows you to add future events to your personal calendars.
Also, an interactive P/L and exposure chart have been introduced in the positions list in the SaxoTraderGO and SaxoTraderPRO platforms showing the PL (unrealized P/L) and exposure for your open trade positions by product type and by instrument. The chart is accessed by selecting the Exposure and P/L button in the position list and shows your exposure by product type.


