

CFDs broker Admirals sees Revenues down 25% in 2H-2024 to multi-year low
After enjoying a slight uptick in activity during the first half of 2024, Estonia based Retail FX and CFDs broker Admirals Group AS has released its unaudited results for the full year, indicating a significant drop-off in Revenues in the second half of 2024, leading to the company’s fifth consecutive (semi-annual) loss.
Admirals results 2024
Admirals reported Revenues (what the company calls Net Trading Income) of €38.4 million in 2024, down 6% from €40.9 million in 2023. However the big decline at Admirals occurred in the second half of the year, when Revenue declined by 25% from €22.0 million in the first half of the year to just €16.4 million in the July-to-December 2024 period – Admirals’ worst period for Revenues since last decade.
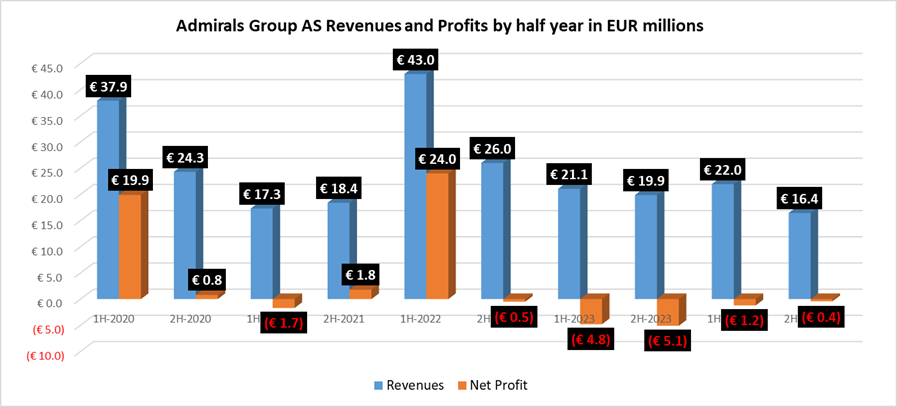
Admirals posted a Net Loss of €1.6 million in 2024, although that was much improved from a €9.7 million loss the previous year. The company was able to cut its losses, despite declining Revenues, thanks to cost optimisation efforts that saw total operating expenses decrease by 16% to €42.4 million in 2024 versus €50.3 million in 2023.
Admirals 2024 operational review

2024 was a year of much change at Admirals. At the beginning of the year we exclusively reported here at FNG that Admirals’ CEO Sergei Bogatenkov, and Cyprus head Andreas Ioannou, were resigning, with Admirals founder Alexander Tsikhilov re-taking the CEO role.
Later in 2024 we also exclusively reported that Admirals suspended the onboarding of new customers in the EU at Admirals Europe Ltd, the Group’s Cyprus based, CySEC-licensed entity. Late in the year Admirals sold its Australia subsidiary, Admirals AU PTY Ltd (Australia).
Admirals Group’s 2024 income statement and balance sheet follow below.
Admirals Group AS Income Statement 2024
| (in thousands of euros) | 2024 | 2023 |
| Net gains from trading of financial assets at fair value through profit or loss with clients and liquidity providers | 40,653 | 46,276 |
| Brokerage and commission fee revenue | 1,408 | 2,134 |
| Brokerage and commission fee expense | -3,558 | -5,118 |
| Other trading activity related income | 489 | 412 |
| Other trading activity related expense | -583 | -2,768 |
| Net income from trading | 38,409 | 40,936 |
| Other income similar to interest | 947 | 171 |
| Interest income calculated using the effective interest method | 424 | 900 |
| Interest expense | -472 | -496 |
| Other income | 3,004 | 741 |
| Other expenses | -233 | -185 |
| Net losses on exchange rate changes | -1,016 | -984 |
| Profit / (loss) from financial assets at fair value through profit or loss | -444 | 61 |
| Personnel expenses | -13,394 | -15,231 |
| Operating expenses | -25,412 | -31,875 |
| Depreciation of tangible and intangible assets | -2,594 | -2,310 |
| Depreciation of right-of-use assets | -787 | -837 |
| (Loss) before income tax | -1,568 | -9,109 |
| Income tax | -24 | -616 |
| (Loss) for the reporting period | -1,592 | -9,725 |
| Other comprehensive income / (loss): | ||
| Items that subsequently may be reclassified to profit or loss: | ||
| Currency translation adjustment | 864 | -165 |
| Total other comprehensive income / (loss) for the reporting period | 864 | -165 |
| Total comprehensive (loss) / income for the reporting period | -728 | -9,890 |
| Net (loss) attributable to the owners of the parent | -1,592 | -9,746 |
| Net profit attributable to non-controlling interest | 0 | 21 |
| (Loss) for the reporting period | -1,592 | -9,725 |
| Total comprehensive (loss) attributable to the owners of the parent | -728 | -9,911 |
| Total comprehensive income attributable non- controlling interest | 0 | 21 |
| Total comprehensive (loss) for the reporting period | -728 | -9,890 |
| Basic and diluted earnings per share | -0.65 | -3.95 |
Admirals Group AS Balance Sheet 2024
| (in thousands of euros) | 31.12.2024 | 31.12.2023 |
| Assets | ||
| Cash and cash equivalents | 41,607 | 41,025 |
| Due from investment companies | 18,736 | 18,961 |
| Financial assets at fair value through profit or loss | 1,228 | 5,062 |
| Loans and receivables | 8,315 | 4,772 |
| Inventories | 665 | 311 |
| Other assets | 2,092 | 2,137 |
| Tangible fixed assets | 1,359 | 1,950 |
| Right-of-use assets | 2,541 | 2,603 |
| Intangible assets | 3,304 | 5,147 |
| Total assets | 79,847 | 81,968 |
| Liabilities | ||
| Financial liabilities at fair value through profit or loss | 334 | 224 |
| Liabilities and accruals | 3,326 | 4,318 |
| Deferred tax liability | 0 | 1 |
| Subordinated debt securities | 4,103 | 4,102 |
| Lease liabilities | 2,818 | 2,894 |
| Total liabilities | 10,581 | 11,539 |
| Equity | ||
| Share capital | 250 | 250 |
| Own shares | -456 | -315 |
| Statutory reserve capital | 25 | 25 |
| Currency translation reserve | 30 | -834 |
| Retained earnings | 69,417 | 71,276 |
| Total equity attributable to owners of the parent | 69,266 | 70,402 |
| Non-controlling interest | 0 | 27 |
| Total equity | 69,266 | 70,429 |
| Total liabilities and equity | 79,847 | 81,968 |